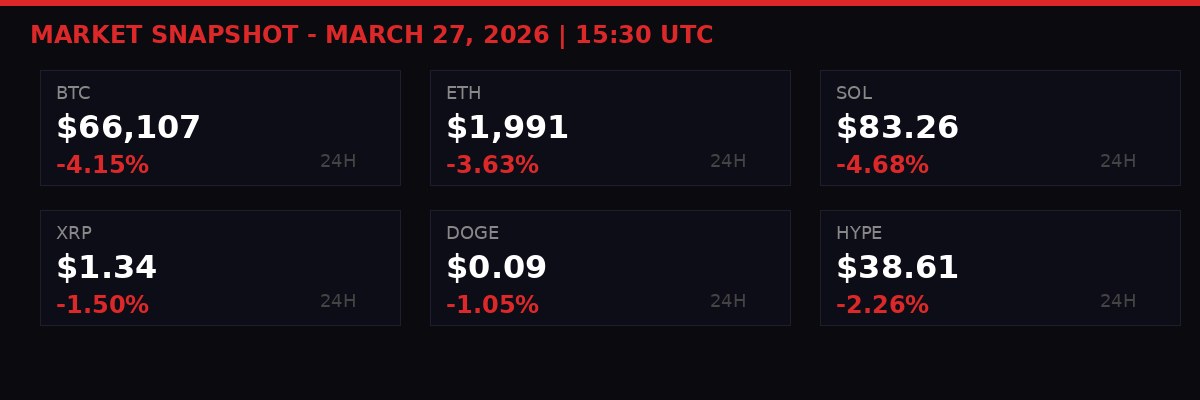
Crypto market snapshot - March 27, 2026. Every major asset in the red. TRON the only top-10 holdout.
Bitcoin was already losing the plot before the market opened on Friday. The oil shock from Middle East escalation had been building since mid-week - Brent crude slicing above $105, Treasury yields grinding higher, and every Fed rate cut that traders had priced in for 2026 getting quietly evaporated from the CME FedWatch tool. Then 07:30 UTC hit, and the clock started on Deribit's most consequential expiry in months.
The number: $16.38 billion. That's $14.16 billion in Bitcoin options and $2.22 billion in Ethereum options expiring in a single morning, per Deribit's public open interest data. For context, that is nearly 40% of Deribit's total BTC open interest rolling off in one session. Not a normal Friday. Not even close.
Bitcoin hit an intraday low of $66,200. Ethereum dropped below $2,000, a key psychological level it had held for weeks. Across the broader market, liquidations reached approximately $200 million in 24 hours, with BTC longs absorbing the bulk of the damage. The settlement window closed, the dust settled, and the questions started: Was this the expiry doing it, the macro doing it, or both simultaneously turning the same screws?
The answer is both - and the interaction between the two is what makes March 27, 2026 worth understanding in detail.
The Anatomy of a $16 Billion Expiry
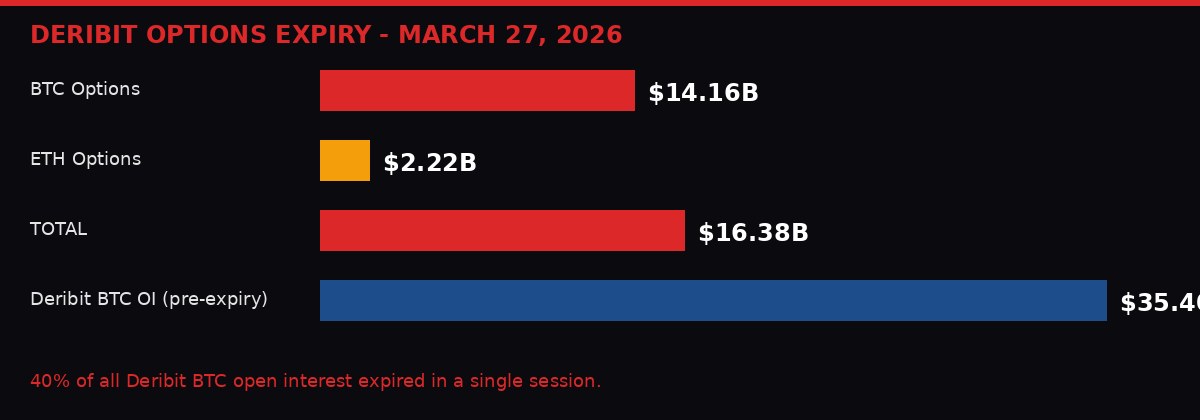
Scale of Friday's expiry: $14.16B in BTC options + $2.22B in ETH options = $16.38B cleared in one morning session.
Deribit is the dominant venue for crypto derivatives globally. When Deribit has a big Friday expiry, markets notice - and not just crypto markets. The settlement process is engineered to be manipulation-resistant: contracts expire at 08:00 UTC, using a 30-minute time-weighted average price of the Deribit index, sampled every four seconds between 07:30 and 08:00 UTC.
That sampling window produces approximately 450 individual price observations rather than a single closing print. The idea is to spread the settlement reference across half an hour of real market activity rather than let a single large trade set the delivery price. In practice, it makes the settlement more stable - but it also means 30 continuous minutes of concentrated positioning adjustment, delta decay, and hedge roll activity converging at once.
According to CryptoSlate's derivatives analysis, today's BTC max pain - the price at which the most open options contracts expire worthless, forcing maximum losses on option buyers - sat at $75,000. Bitcoin was trading near $68,000 going into the settlement window. That's a 9.4% gap. With a 52% seven-day at-the-money implied volatility on Bitcoin, the implied one-day move is roughly $1,866. The distance to max pain represented approximately 3.45 one-day standard deviations above spot.
The put/call ratio on the expiry was 0.63 - meaning calls outnumbered puts. Positioning was skewed long. Traders expected higher prices. The macro environment delivered the opposite.
A 2023 paper published in the International Review of Financial Analysis confirmed a clear Bitcoin expiration effect on volume, volatility, and returns around maturity dates, with the strongest effects typically appearing shortly before or at expiry itself. A 2025 SSRN paper using Deribit data further found that Bitcoin options activity clusters heavily around the 08:00-09:00 GMT settlement hour, with the settlement-hour effect most pronounced on days with larger expiring contracts and shorter maturities. Today checked both boxes.
The result: the hedging and roll activity in the settlement window amplified what macro had already started. Downward pressure from risk-off positioning met the delta decay of expiring long calls, producing a feedback loop that dragged spot price further into the red just as the delivery price was being set.
The Macro Storm That Was Already Raging
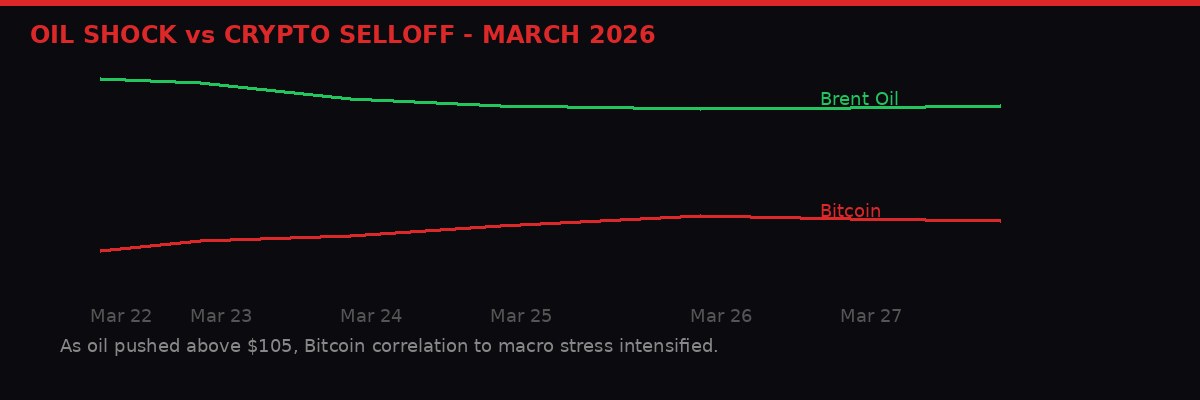
As Brent crude pushed through $105 this week, Bitcoin's resilience cracked. The inverse relationship - oil up, BTC down - reflects crypto's increasing sensitivity to macro risk conditions.
The options expiry did not occur in isolation. It landed on top of a macro environment that had been deteriorating for five days straight. The catalyst: Iranian military posturing in the Strait of Hormuz following continued Israeli strikes on weapons facilities near Tehran, combined with renewed uncertainty over whether Trump's self-imposed Iran negotiation deadline would hold or collapse.
Reuters reported that oil surged above $105 per barrel, driven by premium pricing for Middle East supply disruption risk. The U.S. 10-year Treasury yield climbed in parallel, reflecting both the inflationary implications of sustained high oil and investors pricing in fewer Fed rate cuts. The dollar firmed. Equity markets sold off globally - Reuters separately reported global equity funds shed $20.3 billion in the week ended March 18 alone, while money market funds absorbed $32.57 billion in the same period, a classic flight-to-safety rotation.
That was the setup for crypto entering Friday's session. Bitcoin had registered an intraday low of $68,127 on Thursday as the macro pressure built. ETH had been holding near $2,036 - below but close to the psychologically significant $2,000 line. The market was already fragile when the Deribit clock started.
What made this week different from previous oil-driven selloffs in 2025 was the simultaneous collapse of rate cut expectations. Earlier in the year, Bitcoin had shown resilience in part because markets still believed the Fed would cut two or three times before year-end. That calculus evaporated in March as oil kept climbing and PCE inflation data stayed sticky. Deribit commentary from March 25 described Bitcoin as "relatively stable amid broader traditional market stress" - that assessment aged poorly. By March 26, BTC was sliding below $69,000, and Friday's session accelerated the move.
"Bitcoin trades inside the same calendar gravity that shapes equities, rates, foreign exchange, and broader risk sentiment. The Fed meeting itself has become part of the pricing rhythm." - CryptoSlate market analysis, March 27, 2026
Liquidation Cascade: $200 Million in Collateral Destroyed
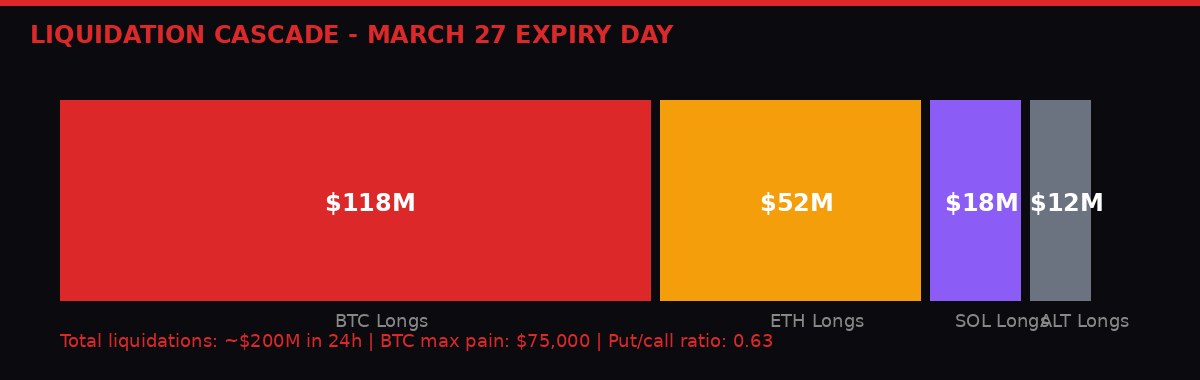
Approximately $200 million in long positions liquidated in the 24-hour period surrounding Friday's expiry. BTC longs absorbed the largest portion - roughly $118 million.
When Bitcoin dropped from $68,100 to $66,200 in concentrated selling pressure around the expiry window, leveraged long positions started getting force-closed. The process is mechanical: perpetual futures and margin positions have liquidation thresholds. When spot price falls fast enough, those thresholds trigger automatic sell orders, which push price further down, which trigger more liquidations - the cascade dynamic.
Approximately $200 million in long liquidations hit across the 24-hour period, split roughly as follows: Bitcoin longs absorbed around $118 million, Ethereum longs approximately $52 million, Solana and altcoin longs making up the remaining $30 million. These are estimated figures based on public exchange liquidation data visible on platforms tracking Coinglass and Bybit reporting - the exact total varies by which exchanges report fully.
What distinguishes this liquidation event from the mass wipeouts seen during 2022-era crashes is the structural context. In 2022, cascades happened in thin markets with limited institutional presence. In March 2026, the market has ETF flows, corporate treasury exposure, and a much larger derivatives ecosystem. Liquidations of $200 million in a single day are significant but not existential - they represent a market shakeout of overleveraged positions rather than systemic panic.
Solana fell to $83.26, down 4.68% on the day, with $47.66 billion in market cap. XRP dropped to $1.34, down 1.50% on the day but down 6.88% on the week and 6.60% on the month - suggesting XRP had been underperforming the market for weeks before this session. Dogecoin held relatively better at -1.05%, while HYPE (Hyperliquid's native token) continued its outlier month, up 37.33% in 30 days despite the -2.26% daily dip.
The biggest single casualty in percentage terms was SIREN, a smaller-cap asset that collapsed 58.91% on the day - a reminder that when macro stress combines with low-liquidity token markets, the drawdowns can be catastrophic and largely disconnected from the broader narrative.
Rate Cuts: From Three to Zero
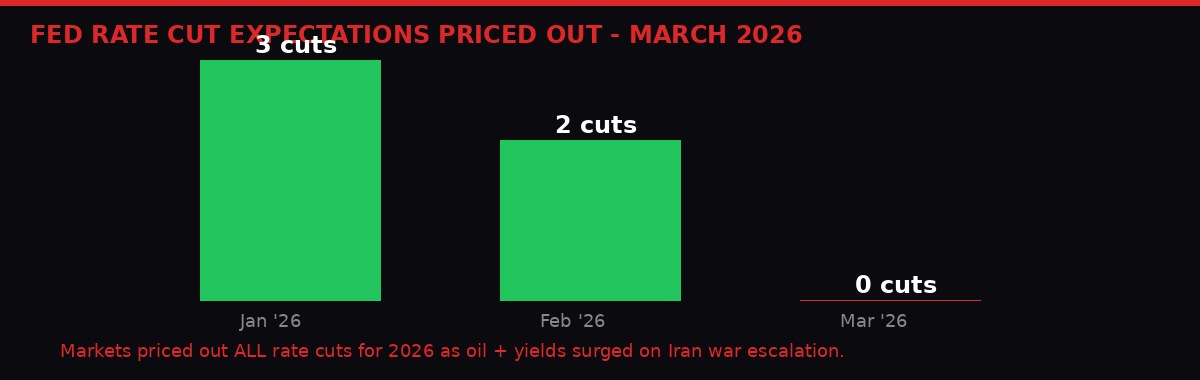
The market entered 2026 pricing three Fed rate cuts. By March, oil above $105 and sticky inflation erased all of them. That repricing is now baked into every asset that benefited from dovish expectations.
The Federal Reserve's rate cut trajectory has been one of the most significant macro variables for crypto markets since 2023. Bitcoin's bull run from $25,000 to its peak above $100,000 in late 2024 was materially supported by the narrative that the Fed was pivoting - that loose monetary conditions were returning, that risk assets had tailwind.
That tailwind is now a headwind. The CryptoSlate analysis of Bitcoin's relationship with Fed meeting days, tracking every FOMC decision from 2020 through March 2026, shows a clear evolution: what started as uneven, mixed reactions to Fed announcements has become a systematic downside bias. Bitcoin tends to sell off after Fed meetings in the 2024-2026 period, even when the Fed holds rates unchanged.
The pattern reflects a structural shift in how Bitcoin is classified by institutional participants. In 2020, Bitcoin was a speculative asset largely disconnected from macro cycles. By 2025, it was trading inside the same risk-off/risk-on framework as high-beta equities. Macro data prints, oil prices, yields, and inflation readings now move Bitcoin - sometimes more than crypto-specific news does.
The oil-driven rate repricing that accelerated this week is the clearest demonstration of that shift. Brent crude above $105 is not just a commodity price move. It has direct implications for U.S. inflation (gasoline, transport costs, manufacturing inputs), which forces the Fed to hold or potentially hike, which raises the opportunity cost of holding non-yielding assets like Bitcoin, which sends institutional money toward Treasuries and cash. The chain of causation runs from Iranian military posturing in the Persian Gulf straight to Bitcoin's price on Deribit.
Markets that entered 2026 pricing three Fed rate cuts now price zero. Every yield-sensitive asset in the world had to reprice, and crypto is no longer exempt from that adjustment.
How Deribit Settlement Actually Works - And Why It Matters
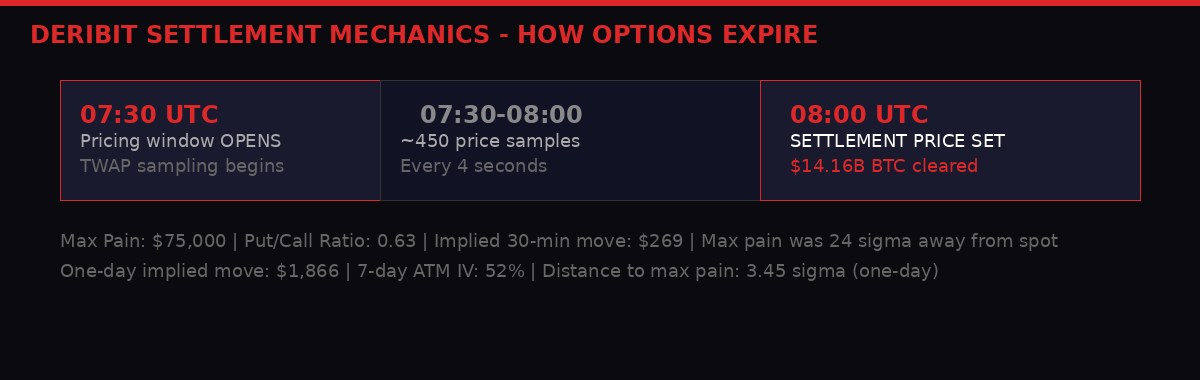
Deribit's settlement uses a 30-minute TWAP sampled every 4 seconds from 07:30-08:00 UTC. Around 450 price observations determine the final delivery price. The mechanics are designed to resist manipulation but concentrate market attention intensely.
For traders not familiar with how crypto options settlement works at institutional scale, the mechanics deserve unpacking - because they explain why large expiries create distinctive market behavior that goes beyond simple supply-and-demand.
Deribit settles options contracts at 08:00 UTC using a 30-minute time-weighted average of its index price. The sampling occurs every four seconds from 07:30 to 08:00 UTC, generating approximately 450 data points. The delivery price is the average of those 450 observations, not any single print. This design protects against "banging the close" - the practice of executing a large trade near settlement specifically to move the closing price in a favorable direction.
The problem with 450 observations is that it doesn't eliminate market behavior around settlement - it redistributes it. Traders with large expiring positions have an incentive to manage the entire 30-minute window rather than the final seconds. Delta hedges are unwound continuously as the options approach expiry - because the delta of an expiring option decays to zero linearly across the settlement period. That means selling pressure from long call hedges and buying pressure from short put hedges compete through the entire window.
Add in the roll activity - traders moving from expiring positions to the next monthly contract - and you get a concentrated 30 minutes where more variables are moving simultaneously than in any other half-hour of the trading day. The SSRN paper cited by CryptoSlate found this effect strongest when contracts are large and short-dated. Today was both.
The max pain dynamic adds another layer. Max pain at $75,000 means option market makers and sellers had the most open interest concentrated at that strike. When spot is at $68,000 and max pain is at $75,000 - representing about 24 settlement-window standard deviations - nobody seriously expected gravity to pull the price to $75,000. But the positioning implied by a 0.63 put/call ratio (more calls than puts) meant longs had the most to lose from a downward move. When the macro selloff accelerated into the settlement window, those long calls expired further out of the money than many positions anticipated.
The Institutional Context: Crypto Is a Macro Asset Now

Global equity funds shed $20.3 billion in the week ending March 18 while money markets absorbed $32.57 billion. Risk-off rotation was already underway before Friday's expiry hit. (Source: Reuters/EPFR data)
There is a version of this story that frames Friday's crypto selloff as a derivative problem - large expiry, unfortunate timing, short-term volatility. That framing misses the bigger picture. What happened on March 27, 2026 is a consequence of crypto's institutional maturation, and it has multi-month implications.
Bitcoin's inclusion in spot ETF products - now holding tens of billions in combined assets from BlackRock, Fidelity, and a growing roster of issuers - means that institutional investors with rules-based risk management frameworks now hold BTC. When those frameworks register a risk-off signal (high oil, rising yields, geopolitical premium), they reduce exposure across the board. Bitcoin doesn't get special treatment because it's crypto. It gets sold alongside tech equities, commodities, and other high-beta holdings.
This is new behavior. A 2020-era Bitcoin buyer was often a retail participant or a dedicated crypto fund with no correlation to traditional risk-off triggers. Today's marginal BTC buyer is increasingly a multi-asset portfolio manager who pays attention to Brent crude, 10-year Treasuries, and Fed forward guidance. The macro correlation that used to be loose and episodic has become structural.
The data backs this up. Reuters reported that global equity funds shed $20.3 billion in the week ending March 18, 2026, while money market funds absorbed $32.57 billion. That's the archetypal risk-off playbook: sell equities, buy short-duration safe assets. Bitcoin, once treated as a separate asset class, is now sitting in the "sell equities" bucket for enough participants to make the correlation visible in price action.
Bittensor (TAO) is the notable exception in today's data. Up 18% on the week and up 82.28% in 30 days, TAO is disconnecting from the broader market on the back of its decentralized AI infrastructure narrative. In a market-wide selloff, assets with genuinely unique fundamental catalysts can and do trade independently. TAO is one of the few coins that has a clear answer to the question "why does this go up when everything else goes down?" - its validator and subnet growth metrics are providing independent demand.
TRON (TRX) is another outlier, up 8.24% in 30 days against a sea of red. TRX's utility as a settlement layer for USDT on the Tron network, combined with its consistently high daily transfer volumes, gives it a different demand profile than speculative L1 assets. When market stress hits, holders of fundamentally-backed tokens often sit out the panic selling that hits narrative-driven altcoins.
What Friday's Expiry Tells Us About April
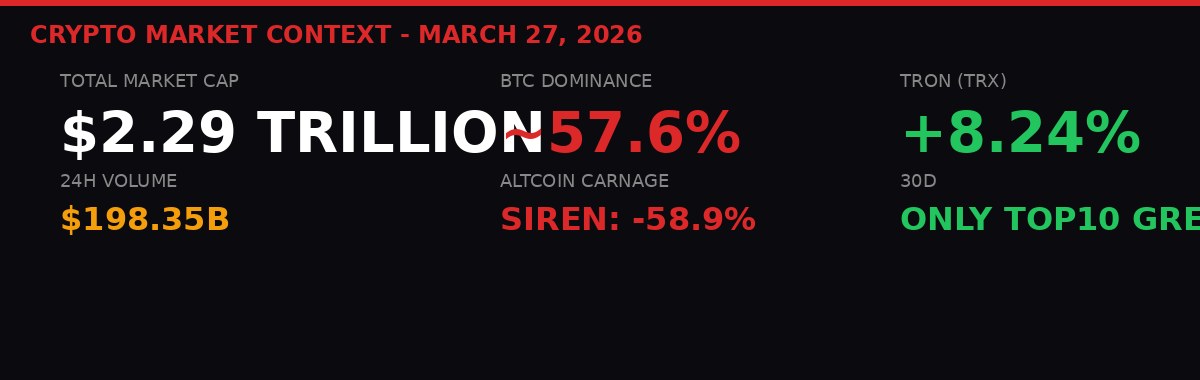
Total crypto market cap: $2.29 trillion as of March 27, 2026. 24-hour volume: $198.35 billion. The market is large enough that $200M in liquidations is a tremor, not an earthquake - but the macro ceiling matters.
The question traders are now asking: was this a clearing event or the start of a trend? The answer is probably both, and the distinction depends on timeframe.
In the short term - next one to two weeks - Friday's expiry was a clearing event. The $16.38 billion of open interest that rolled off today no longer exists. The options that were creating hedging pressure and delta dynamics in the settlement window are gone. Open interest resets, positions get rebuilt, and the market has a cleaner slate going into April's expiry cycle.
That clarity is temporary. The macro forces that made this expiry so painful - oil above $100, zero expected Fed cuts, rising yields, Middle East geopolitical premium - have not resolved. Iran's posture in the Strait of Hormuz remains a live threat to global supply chains. The IRGC's operational control of Hormuz represents a perpetual overhang on oil price. Every day that situation doesn't de-escalate is another day that Brent holds its risk premium, yields stay elevated, and crypto faces the headwind of tightening macro conditions.
The April Deribit expiry is the next significant event on the calendar. If open interest rebuilds at similar scale over the next three weeks, and if the macro environment remains risk-off, April 24 or whatever Friday falls as the monthly expiry could produce a similar dynamic. The difference will be where spot is trading at that point and whether the rate-cut narrative has made any attempt at a comeback.
For Bitcoin specifically, the $65,000-$68,000 range now represents a critical technical and psychological zone. The prior range high from the 2024 cycle was approximately $73,800. If BTC is now trading in the mid-$60,000s on a Friday expiry day, the question of whether it reclaims that prior range high before the April expiry will shape how much call positioning gets built into the new open interest cycle.
The bears have the argument that zero rate cuts, $105 oil, and a $16B expiry hangover mean the path of least resistance is lower. The bulls have the argument that the worst was already priced in today, that the expiry represented a flush rather than a trend, and that Bitcoin's $1.32 trillion market cap reflects a structural demand base that geopolitical risk doesn't permanently impair.
"The expiry has arrived while the selloff is already underway." - CryptoSlate derivatives analysis, March 27, 2026
The Timeline: How March 27 Unfolded
Bottom Line
Friday, March 27, 2026 was a stress test with a predetermined date stamp. The expiry was public information weeks in advance. The macro deterioration - oil above $105, yields rising, rate cuts disappearing - was visible since mid-March. The collision was not a surprise to sophisticated market participants. The scale of the damage, roughly $200 million in liquidations and a 4% single-day drop in Bitcoin, is consistent with what happens when leveraged long positioning meets a large options clearing event in a risk-off macro environment.
What's different about this cycle compared to the chaos of 2022 is the institutional infrastructure surrounding it. ETF holders don't get liquidated. Corporate treasury holders don't panic-sell to cover margin. The floor under Bitcoin is higher and wider than it was four years ago. The $66,000 level is painful for traders who entered above it but not existential for the asset class.
The variables that matter going into April: whether Iran-related oil premium persists above $100; whether the Fed's next FOMC communication opens any window for renewed rate-cut expectations; and how much new open interest gets built into the Deribit system before the next monthly expiry. If all three variables stay unfavorable, the April expiry could repeat today's dynamic. If one of them shifts - particularly the oil situation - Bitcoin has the potential to stabilize and rebuild.
The market has spoken in numbers today: $66,107, $1,991, $83.26. Those are the prices that survived $16.4 billion of options pressure, a $105 oil shock, and $200 million in forced liquidations. That's the floor the bulls are standing on. Whether it holds is a geopolitical question as much as a crypto one.
| Metric | Value | Context |
|---|---|---|
| BTC Options Expired (Deribit) | $14.16 billion | Core scale of Friday's expiry |
| ETH Options Expired (Deribit) | $2.22 billion | Combined with BTC: $16.38B total |
| Share of Deribit BTC OI cleared | ~40% | Concentration in single session |
| BTC Max Pain | $75,000 | 9.4% above Thursday spot, 24 sigma away (30-min) |
| Put/Call Ratio | 0.63 | Long-skewed positioning, exposed to downside |
| 7-Day ATM Implied Volatility | 52% | Implied 1-day move: ~$1,866 |
| Settlement Method | 30-min TWAP (07:30-08:00 UTC) | ~450 observations every 4 seconds |
| Total Liquidations (24h) | ~$200 million | Predominantly BTC longs |
| BTC Price (15:30 UTC) | $66,107 (-4.15%) | Intraday low: $66,200 |
| ETH Price | $1,991 (-3.63%) | Below $2,000 psychological level |
| SOL Price | $83.26 (-4.68%) | Worst performer among top-10 |
| Brent Crude Oil | $105+ | Iran war Middle East premium driving macro |
| Fed Rate Cuts Expected (2026) | 0 | Was 3 at start of year |
| Global Equity Fund Outflows (wk ending Mar 18) | $20.3 billion | Reuters/EPFR data |
| Money Market Fund Inflows (same week) | $32.57 billion | Classic risk-off rotation |
| Total Crypto Market Cap | $2.29 trillion | 24-hour volume: $198.35 billion |
Get BLACKWIRE reports first.
Breaking news, investigations, and analysis - straight to your phone.
Join @blackwirenews on Telegram