Gold Loses Its Safe-Haven Crown. Bitcoin Didn't.
JPMorgan's latest research report contains a line that would have been unthinkable a year ago: gold's market breadth has now declined below that of bitcoin. The world's oldest safe-haven asset is losing a liquidity race to a 17-year-old digital token - in the middle of a shooting war.

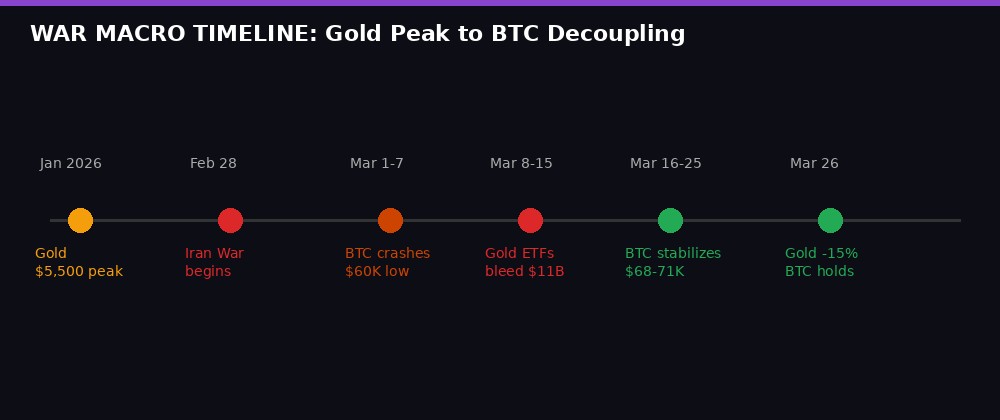
Gold peaked at $5,500 per ounce in January 2026 and was supposed to be the one asset that holds when everything else breaks. Then Iran-U.S.-Israel war ignited on February 28, oil spiked past $100 a barrel, and gold did something it never does during genuine geopolitical crises: it collapsed.
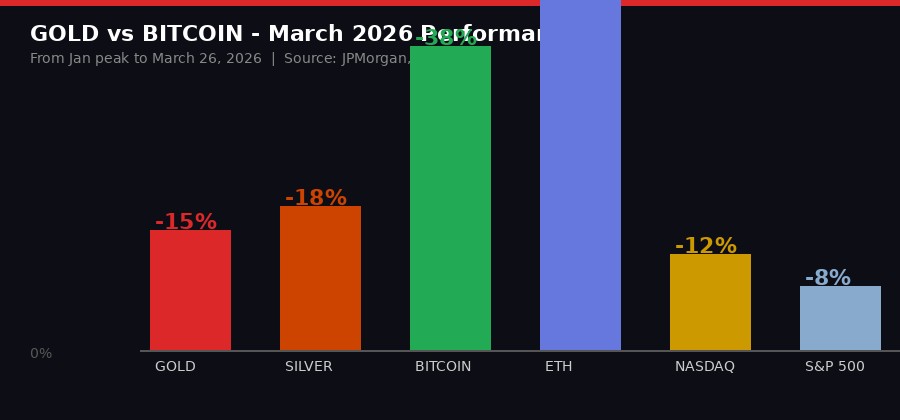
As of Thursday's close, gold has shed roughly 15% from its January high, trading near $4,450/oz. Silver is down even harder from its $120 peak, now around $69. Meanwhile, bitcoin - the asset constantly dismissed as too volatile, too speculative, too new for serious money - has held its range between $68,000 and $71,000 through the same period of maximum chaos.
JPMorgan's quantitative research team, led by analyst Nikolaos Panigirtzoglou, flagged this divergence in a Wednesday note that landed on trading desks like a grenade. The bank's proprietary market breadth indicators - which measure liquidity depth and positioning across major asset classes - now show bitcoin scoring higher than gold.
That is not a mistake. That is a structural shift. And the numbers behind it are damning for the gold complex.
Market Snapshot - March 26, 2026, 20:00 CET
Data: CoinDesk, JPMorgan Research, CME Group, March 26, 2026
The $11 Billion Exodus From Gold ETFs

In the first three weeks of March alone, gold ETFs suffered nearly $11 billion in net outflows, according to JPMorgan's data. Silver ETF inflows that had been building since last summer were entirely reversed. Both precious metals saw their institutional holders walk straight out the door.
That is not panic selling by retail investors. That is systematic, deliberate portfolio repositioning by institutions that crowded into gold and silver through late 2025 and early 2026 expecting a safe-haven trade. The trade worked beautifully from September through January as global tensions mounted and gold climbed from $2,800 to $5,500.
Then war actually broke out. And the institutions hit the exit button simultaneously.
The mechanics are straightforward: gold's run to $5,500 was crowded. When the Iran war began and risk-off pressure spiked, margin calls hit across portfolios. Institutions sold their most liquid assets first - and that meant liquidating gold positions that had enormous unrealized gains. The selling cascaded, driving gold down faster than most risk assets.
JPMorgan's futures positioning data tells the same story. CME open interest in gold and silver futures surged to extreme highs through late 2025, then unwound sharply from January into March. Trend-following Commodity Trading Advisors (CTAs) went from maximum-long to below-neutral on gold in the span of six weeks.
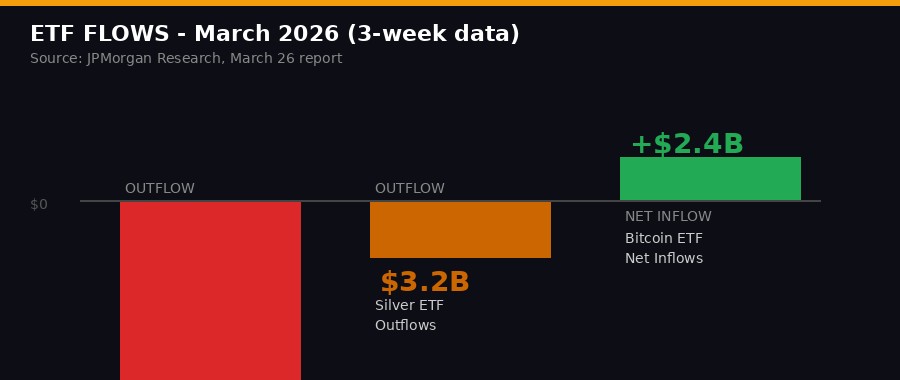
Bitcoin ETFs, by contrast, held net positive inflows over the same period. The numbers are not huge - JPMorgan estimated modest net inflows compared to gold's massive outflows - but the direction is what matters. Bitcoin attracted buying while gold attracted selling during the same geopolitical shock.
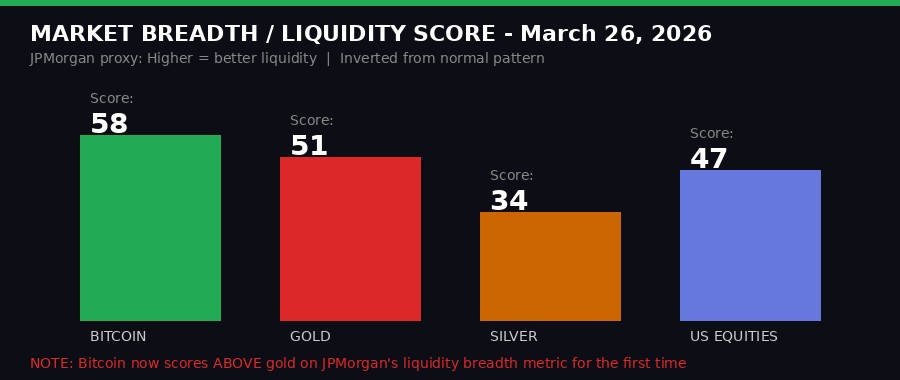
"The deterioration in liquidity conditions in gold has seen its market breadth decline below that of bitcoin currently," JPMorgan's Panigirtzoglou team wrote. The language is clinical and precise. The implication is explosive.
The Market Breadth Reversal JPMorgan Just Flagged

Market breadth measures the proportion of assets within a class that are trending positively relative to their moving averages. A breadth reading above 50 suggests healthy, broad-based participation. Below 50 signals deteriorating internals and weakening liquidity depth.
For most of recorded history, bitcoin's breadth reading has trailed gold's. Bitcoin is newer, smaller, more speculative, and more volatile. Gold markets are centuries old with deep institutional infrastructure - central bank reserves, allocated accounts, futures markets, physical delivery networks.
That relationship has now inverted.
JPMorgan's Thursday report put bitcoin's market breadth above gold's. Exact figures were not released in the public version of the note - these are client-facing research documents - but CoinDesk obtained the summary. The bank's assessment: bitcoin's liquidity depth currently exceeds gold's on their proprietary metric.
Silver is in worse shape than either. JPMorgan noted that silver's thin market depth has amplified recent price moves, with liquidity deteriorating faster than gold's. A 15% drawdown in silver requires far less forced selling than the same move in gold - silver's market cap and daily trading volume are a fraction of gold's.
What this means for institutions managing multi-asset portfolios is significant. Liquidity is the first thing institutional risk managers protect when markets stress. If bitcoin now offers better liquidity than gold in certain measures, the argument for holding gold as the primary crisis hedge weakens.
Bernstein, separately, flagged a similar dynamic last week. The broker called bitcoin's recent correction a "bottom" and maintained its $150,000 year-end price target, citing improving institutional flows and the asset's relative performance versus precious metals since the Iran war began.
Why Gold Failed the Wartime Test

Gold's failure to perform as a safe haven during the Iran conflict is not primarily a story about the asset's fundamentals - it is a story about positioning and leverage.
By January 2026, gold had become one of the most crowded trades on the planet. Hedge funds, sovereign wealth funds, pension funds, and family offices all held substantial gold positions built over the preceding 18 months as geopolitical tensions (US-China trade war, Russia-Ukraine, Middle East instability) drove demand. Gold went from $2,800 to $5,500 in roughly 14 months - a 96% rally that made precious metals the best-performing major asset class of 2025.
When the actual shooting war started February 28, those positions were already stretched. The initial shock sent gold briefly higher as expected. Then two things happened simultaneously: oil spiked past $100, raising inflation concerns that pushed real interest rates higher; and institutions began receiving margin calls on their leveraged positions in other assets, forcing them to sell the things with gains - which meant gold.
Rising interest rates are structurally bad for gold because they raise the opportunity cost of holding the non-yielding metal. When the US 10-year Treasury yield is at 4.40% - where it sits today, up 7 basis points on Thursday alone - sitting in gold means forgoing a guaranteed 4.40% annual return. As the Iran conflict drove yields higher through inflation fears, the math on gold positions deteriorated.
The German Bund yield, up 10.5 basis points Thursday to 3.06%, tells the same story in European terms. Global bond markets have moved aggressively against gold's thesis.
"The deterioration in liquidity conditions in gold has seen its market breadth decline below that of bitcoin currently." - Nikolaos Panigirtzoglou, JPMorgan Global Markets Strategy, March 26, 2026
Bitcoin, by contrast, already absorbed its own war-related sell-off and found support. The asset dropped sharply from its October 2025 all-time high of $111,000 through a painful correction into the low-$60,000 range in the immediate aftermath of February 28. Then it stabilized. Long-term holders stepped in. ETF inflows continued. And the result is a $68,000 floor that has held even as gold keeps sliding.
Bitcoin's Behavior as a "High-Beta Macro Asset"
Bitcoin is not acting like a safe haven in the traditional sense. It did not go up when the war started. It went down - hard. From $111,000 in October to $60,000 briefly in early March. That is a 46% drawdown from peak, which is a number that would destroy any institutional portfolio holding it as a crisis hedge.
What bitcoin IS doing is something more interesting: it is recovering and holding while gold keeps falling. The trajectory matters as much as the absolute level.
JPMorgan analysts describe this as bitcoin behaving like a "high-beta macro asset" rather than a safe haven. In the immediate shock phase, it sells off harder than everything else. Once the panic subsides and longer-term holders step in, it finds support and stabilizes. The subsequent recovery curve is steeper than traditional assets.
Joel Kruger, market strategist at LMAX Group, told CoinDesk that "the near-term trajectory will likely remain tied to macro developments." A clear path toward Iran ceasefire - the 15-point US peace plan is still live, though fading hopes Thursday sent markets lower - could push risk assets including bitcoin significantly higher. Sustained uncertainty means continued choppy range-trading.
The 90-day correlation between bitcoin and the S&P 500 remains elevated. But the sensitivity has been asymmetric throughout the war: bitcoin sells off proportionally with risk assets during bad news, but recovers faster and holds better during stabilization periods. Gold sells off during stabilization periods AND during bad news - the worst of both worlds when the position is crowded.
Thursday's session amplified the divergence. Bitcoin slipped 3% from its overnight high above $71,000 as oil prices reversed higher (+4%) on fading Middle East peace hopes. Ether dropped 4-5%, XRP fell similarly, Solana shed 4%+ . But bitcoin's absolute level - $68,400 as of the afternoon session - represents a $68,000+ floor that has held for nearly two weeks.
The Magnificent Seven tech stocks, by comparison, are all down double-digits from their all-time highs: NVIDIA -18%, Microsoft -34%, Meta -30%, Amazon -20%, Tesla -25%, Apple -14%, Alphabet -19%. The index-weighted equities that dominate most institutional portfolios are in far worse shape than bitcoin on a percentage basis from recent peaks.
Saylor's Monopoly and the Concentration Warning

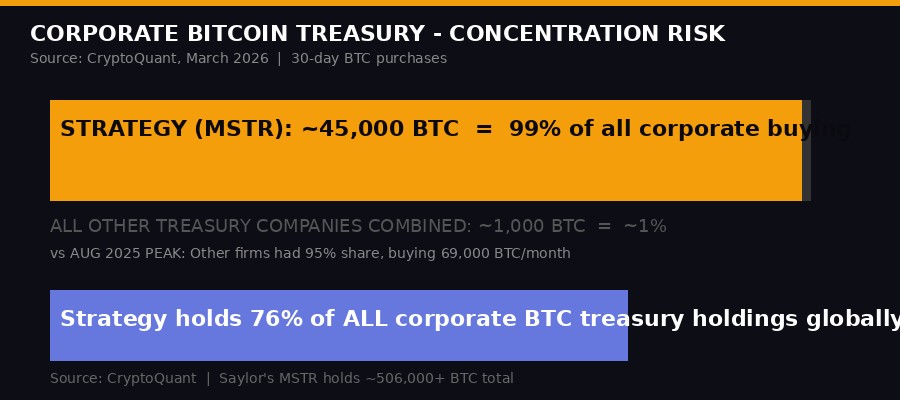
JPMorgan's liquidity findings intersect with another alarming data point published Thursday by CryptoQuant: the corporate bitcoin treasury market has effectively collapsed to a single buyer.
Strategy, Michael Saylor's company, purchased roughly 45,000 BTC over the past 30 days - its fastest accumulation pace since April 2025, according to CryptoQuant. Every other corporate treasury company combined bought approximately 1,000 BTC in the same period. Strategy's share of total corporate purchases: 97-99%. Its share of all bitcoin held by treasury companies globally: 76%.
This matters for liquidity analysis. A significant portion of bitcoin's price support currently comes from a single company's ongoing purchasing program. Strategy holds over 506,000 BTC by most estimates. The structural buying from Saylor represents a consistent bid that other treasury companies are no longer replicating.
The collapse of the broader treasury company cohort traces back to the October 2025 market crash. Companies like Metaplanet and Nakamoto Holdings that loaded up aggressively at prices above $107,000 are now underwater. Their average cost basis puts them deep in the red at $68,000 bitcoin, eliminating the equity-premium-based flywheel that Galaxy Digital warned about in July 2025.
Galaxy's July report predicted exactly this scenario: once equity premiums compress, the mechanism by which treasury companies issue stock to fund bitcoin purchases breaks down. Share issuance becomes dilutive rather than accretive. Companies stop buying. The concentration risk that once seemed theoretical has materialized completely.
"For now, that vision has narrowed to a single balance sheet." - CoinDesk analysis of CryptoQuant treasury company data, March 26, 2026
Strategy has insulated itself by building a $1.44 billion cash reserve (disclosed in December 2025) designed to cover 24 months of dividend and interest obligations regardless of bitcoin's price. That defensive positioning gives Saylor room to keep buying even at these prices without facing immediate financial distress. His STRC perpetual preferred equity - which went ex-dividend on March 13 - rebounded to par value in just nine trading days, enabling new share issuance and additional bitcoin purchases.
That kind of structural support is not replicable for companies that bought at $107,000. It is unique to a company that built early enough and large enough to have strategic flexibility.
NYSE Goes Blockchain: Wall Street's Incremental Pivot
Against this volatile backdrop of war, oil shock, and asset class rotation, the New York Stock Exchange quietly confirmed Thursday what the industry has long expected: blockchain is coming to Wall Street, but slowly.
Jon Herrick, NYSE's chief product officer, said at the Digital Asset Summit in New York that the exchange is "striving for interoperability" and "building on top of what exists" rather than replacing current infrastructure. Tokenized assets will function within existing clearing, settlement, and regulatory systems - not replace them.
"You have to be mindful of the inherent good things of the market that has developed up to now," Herrick said, flagging centralized clearing as an example of a function that tokenization cannot easily replicate without careful design. "It really isn't about one side being more right than the other - they should, I think, in time, come together."
The parent of the NYSE, Intercontinental Exchange (ICE), made a strategic investment in crypto exchange OKX earlier this month. ICE will license OKX's spot crypto prices for futures products, while OKX will offer ICE futures and tokenized equities to its customers in the US. The partnership is a concrete step toward the "coming together" Herrick described.
The NYSE comment carries weight in the context of today's gold-versus-bitcoin analysis. If the world's largest stock exchange is actively building blockchain infrastructure into its systems and partnering with crypto exchanges, the institutional infrastructure gap between traditional and digital assets is narrowing structurally. JPMorgan's liquidity breadth finding is the market reflecting what the institutions are quietly building in their back offices.
"Maybe 10 years from now, whether a security is tokenized or not shouldn't matter," Herrick said. Ten years is a long time. But the direction of travel is not in question.
The Miners Bleed While MARA Finds a Different Angle

The mining sector took the hardest hits Thursday among crypto-correlated equities. Most public bitcoin miners have already shifted or are shifting to AI and high-performance computing infrastructure, making them dual-exposure plays on both crypto prices and tech sentiment. On a day when both were down, the damage compounded.
Hut 8 (HUT) dropped 8.6%. IREN (IREN) and Riot Platforms (RIOT) each fell more than 7%. TeraWulf (WULF) and HIVE Digital (HIVE) posted steep declines. WhiteFiber parent Bit Digital (BTBT) dropped 8% after WhiteFiber's quarterly results showed a net loss widening to $1.5 million, with a full-year 2025 loss of $24.7 million.
MARA Holdings stood out as the exception - though for reasons that illuminate the structural pressure the sector faces. MARA announced it sold 15,133 BTC between March 4 and March 25 for approximately $1.1 billion, using the proceeds to buy back $1.0 billion face value of its convertible notes at a roughly 9% discount to par.
The move was rational capital allocation: capturing $88.1 million in savings by retiring debt below par, reducing dilution risk, and cutting total convertible obligations from $3.3 billion to $2.3 billion. Shares rose 8-10% on the news. But look past the stock price reaction and you see a company that no longer believes its best use of bitcoin is to hold it. MARA sold BTC to buy back its own bonds at a discount.
That is not a bullish statement on bitcoin's price trajectory. That is a balance sheet preservation play by a company managing significant leverage in a volatile macro environment. CEO Fred Thiel framed it as "strategic capital allocation" and cited the expansion into "digital energy and AI/HPC infrastructure" as the new growth vector. MARA now holds 38,689 BTC following the sale - down from over 50,000 before the program began.
The Forward Equation: What Happens When Peace Talks Either Work or Die

The variable that overrides everything else in this analysis is the Strait of Hormuz and the Iran war's trajectory. The US 15-point peace plan that briefly pushed oil below $100 and bitcoin above $71,000 Wednesday is showing cracks Thursday. Oil futures reversed 4% higher, Treasury yields spiked, and risk assets retreated across the board.
Two scenarios dominate from here:
Scenario A - Ceasefire: A genuine 30-day ceasefire takes hold. Oil drops back toward $85-90 per barrel. Inflation pressures ease. The Fed holds rather than hikes. Risk assets rally - bitcoin could push back toward $75,000-80,000 quickly. Gold would also recover but the crowded positioning means the recovery will be slower and shallower than bitcoin's given remaining overhang. JPMorgan's liquidity breadth advantage for bitcoin may narrow but the structural shifts will persist.
Scenario B - Escalation: Talks fail. Hormuz remains closed or becomes more dangerous. Oil pushes back toward $110-120. Inflation fears mount. Fed considers emergency action. Risk assets including bitcoin test the $60,000-62,000 support again. Gold faces continued selling pressure from institutional deleveraging but eventually finds a floor as central banks step in as buyers. The divergence between bitcoin and gold liquidity metrics persists because institutional crowding in gold remains elevated.
Either way, the JPMorgan finding does not reverse in the next news cycle. Liquidity metrics are structural. The $11 billion in gold ETF outflows has left the building. The CTA positioning unwind in gold and silver is near complete. The institutional damage to the gold-as-safe-haven narrative is real and lasting for this cycle.
For bitcoin, the question is simpler: at $68,000 in a war market with oil at $100 and every major equity index down 10-35% from highs, the asset is proving something. It is not proving it is digital gold. It is proving it is something else - something faster, more liquid in the JPMorgan sense, and increasingly woven into the same institutional infrastructure it was supposed to disrupt.
That is the story of March 26, 2026. Gold lost its crown. Not to a geopolitical crisis, but to the weight of its own crowded position. And bitcoin, battered and far below its highs, held the range.
Key Numbers to Watch
Timeline: The Gold-Bitcoin Divergence
Get BLACKWIRE reports first.
Breaking news, investigations, and analysis - straight to your phone.
Join @blackwirenews on TelegramSources: JPMorgan Global Markets Strategy research note March 26, 2026; CoinDesk market data and reporting; MARA Holdings press release March 26, 2026 (GlobeNewswire); CryptoQuant treasury company analysis; LMAX Group market commentary; Bernstein Research March 24, 2026; ICE/NYSE Digital Asset Summit remarks March 26, 2026. All prices as of approximately 20:00 CET March 26, 2026.