Extreme Fear: Bitcoin Options Hit Panic Territory, VanEck Flags a Dangerous Contrarian Signal
Bitcoin's options market is pricing in catastrophe. Put/call open interest at 0.84 - the highest level since June 2021. VanEck says this exact reading has historically preceded 13% gains in 90 days and 133% in a year. Meanwhile, SBF is angling for a pardon, rate hike bets are back, and $308M got liquidated in 24 hours. This is the market we're in right now.

Bitcoin options traders are paying record premiums for downside protection. Photo: Pexels
// MARKET SNAPSHOT - MARCH 22, 2026
The Fear Reading Nobody Wanted to See

Options traders are loading up on puts at a rate not seen since the summer of 2021. Photo: Pexels
The put/call open interest ratio on Bitcoin just hit 0.84. That number doesn't sound dramatic until you look at the history: the last time it was this high was June 2021, three weeks before Bitcoin crashed from $40,000 to under $30,000. The memory is not a comfortable one.
VanEck's research team flagged the reading in a note published this week. The firm has been tracking extreme put skew events over the past six years, and what they found is counterintuitive: when fear gets this extreme, Bitcoin has historically recovered hard. Average return 90 days after similar readings: +13%. Average return 360 days out: +133%.
The implication is blunt. Either the market is correctly pricing in a major leg down - which would be the first time the extreme fear signal failed to resolve as a contrarian entry - or a very large cohort of traders is buying expensive insurance at exactly the wrong moment.
"Bitcoin traders are paying record prices for downside protection, with the put/call open interest ratio reaching 0.84, the highest level since June 2021, and put premiums reaching an all-time high relative to spot volume." - VanEck Research, March 2026 (via CoinDesk)
The 1-week 25-delta skew has jumped from 9% to 14% in the span of seven days. That is the premium traders are paying for puts versus calls on a risk-adjusted basis. When skew gets this elevated this fast, it signals a crowded hedge trade - everyone reaching for the same insurance at the same time.
The implied volatility term structure adds another layer: it's in backwardation, meaning near-term IV is higher than longer-dated IV. That is not the shape of a market expecting a slow, orderly decline. That is the shape of a market bracing for an immediate shock event within days, not months.
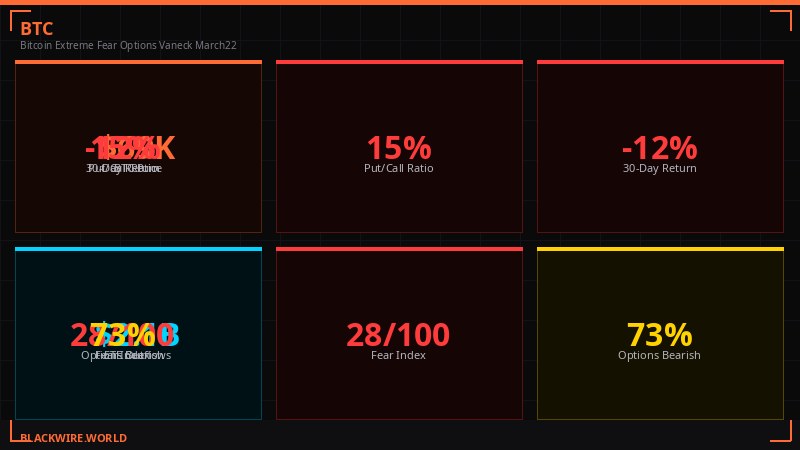
Key derivatives metrics showing the depth of Bitcoin's fear signal as of March 22. Data: CoinDesk, VanEck, Coinglass
What the Historical Data Actually Says

VanEck's six-year lookback finds consistent patterns following extreme put skew in Bitcoin options. Photo: Pexels
VanEck's methodology is straightforward: identify moments when the put skew and put/call OI ratio both hit historical extremes, then measure forward Bitcoin returns at 30, 90, 180, and 360 days. The sample includes six years of data spanning multiple market regimes - the 2020 COVID crash, the 2021 bull cycle, the 2022 bear market, and the 2023-2025 recovery.
The +13% at 90 days is the most actionable number. It doesn't require a year of patience. It suggests that the current panic buying of puts is a sentiment extreme, not a rational assessment of fundamental value. History says the fade wins here.
But here's the critical caveat that VanEck and every honest analyst has to include: this signal has never been tested against a genuine stagflation environment with oil above $90, rate hike bets re-entering the picture, and active military conflict affecting a major oil exporter. The macro backdrop right now is genuinely novel.

Average BTC returns following comparable put skew extremes over the past six years. Source: VanEck Research
The three-month annualized basis sitting at 2.8% confirms the institutional signal: big money is cautious but not bearish. They are not aggressively shorting. They are hedged and waiting. That is a very different market structure from 2022, when the basis turned deeply negative and institutions were actively betting on collapse.
Open interest has stabilized at $16.9 billion, roughly flat with last week's $17 billion. Speculative activity has leveled off. Funding rates have returned to a neutral 0-10% range after going negative earlier this week - those negative rates likely fueled the short-covering relief rally seen mid-week before prices sagged again.
The Binance liquidation heatmap shows $68,500 as the critical level to monitor. That is where the next cascade of long liquidations would trigger if spot drops. Below $68,500, the market structure gets ugly fast.
$308 Million Wiped in 24 Hours
Coinglass reported $308M in liquidations over 24 hours, with Bitcoin and Ethereum accounting for the bulk. Photo: Pexels
Coinglass data shows $308 million in liquidations over the last 24 hours, split 63-37 between longs and shorts. That means two-thirds of the positions blown out belonged to people who were long - bullish bets that got margin-called out of existence.
Bitcoin accounted for $93 million of that total. Ethereum contributed $81 million. Other altcoins added $19 million. The remaining approximately $115 million was spread across various perpetual contracts.
This is not a catastrophic liquidation event by 2025 standards - the market saw days with over $1 billion wiped during major crashes. But $308 million in a period of apparent "consolidation" signals that leverage has not been fully purged from the system. The long-short ratio staying at 63-37 means overzealous bulls are still getting squeezed, even at these prices.
24-hour liquidation breakdown showing $308M total, with Bitcoin and ETH as primary casualties. Source: Coinglass
The altcoin side tells a different story, which is unusual. Quant (QNT) spiked 7.5% after Robinhood added it as a spot listing. AI token FET extended its run with a 6.5% gain. The CoinMarketCap Altcoin Season index sits at 46 out of 100 - well above February's lows in the 20s but not yet indicating a true alt season breakout.
The CoinDesk 80 index - which tracks lower-cap altcoins - outperformed the CoinDesk 20 by 0.3% over the same period. Small but meaningful. When capital rotates into smaller caps while BTC consolidates, it often indicates that traders are hunting for yield and not convinced a BTC breakout is imminent.
SBF Backs Trump's Iran Strikes: Reading the Pardon Play

Sam Bankman-Fried, currently serving 25 years for fraud, has publicly endorsed Trump's Iran military strikes - a move widely read as a pardon bid. Photo: Pexels
Sam Bankman-Fried is still in prison. And he just publicly endorsed Donald Trump's military strikes on Iran.
CoinDesk reported this week that SBF - the former FTX founder convicted on seven counts of fraud and sentenced to 25 years in federal prison - has put his name behind Trump's military campaign in the Middle East. The political calculation is transparent to anyone who has been watching: SBF is trying to get on Trump's good side in hopes of a commutation or pardon.
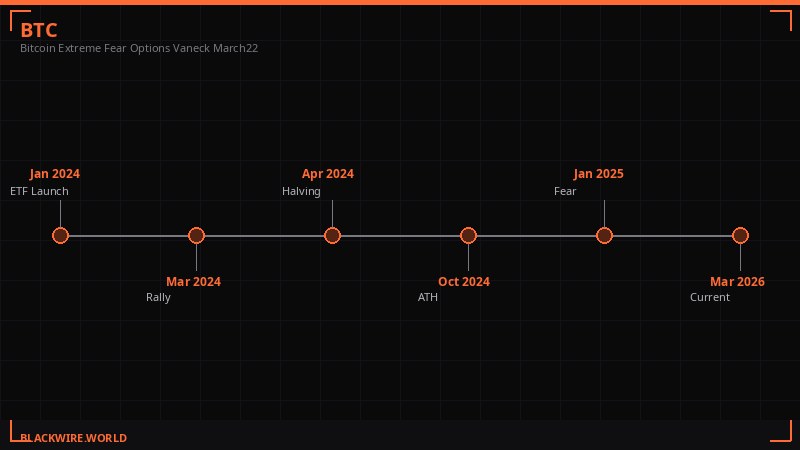
The crypto industry's complicated relationship with pardons began the moment Trump took office in January 2025. Ross Ulbricht, the Silk Road founder serving two life sentences, was pardoned in one of Trump's first major acts. Bitcoin developer Arthur Breitman - not convicted but under pressure - had charges dropped. The message to everyone in prison with a crypto connection was clear: Trump is open to deals.
SBF's political donations prior to his arrest totaled over $100 million, spread across both parties. His AI PAC has since been used to fund attacks on New York political candidates, per CoinDesk reporting. The money machine didn't stop just because he's behind bars.
The Iran connection adds a surreal layer. Bitcoin briefly hit $70,800 on March 20 as oil retreated from above $100 to $96 per barrel - the market interpreted the price drop as a reduction in geopolitical risk premium. But the war isn't over. The U.S. has reportedly been "assessing whether to release sanctioned Iranian oil" to stabilize energy prices, per CoinDesk, which would be an extraordinary policy move given the ongoing conflict.
SBF's backing is ultimately noise for markets. What matters is the signal it sends about the broader political economy of crypto: even from prison, the industry's most infamous fraudster is trying to leverage proximity to power. And the White House appears receptive to exactly this kind of transactional relationship.
SBF's trajectory from FTX collapse in November 2022 to his current political maneuvering from federal prison. Sources: Reuters, CoinDesk, Court Records
Rate Hike Bets Return: The Macro Pressure That Won't Go Away

Rate hike expectations are returning to markets as oil prices remain elevated above $90 despite a brief dip below $100. Photo: Pexels
The Fed has not raised rates. But the market is starting to price it back in.
Crude oil spiked above $108 per barrel earlier in March as conflict with Iran escalated - BLACKWIRE covered the WTI shock in detail when it hit. It's since retreated to around $96 as diplomatic noise and tactical ceasefire discussions created a temporary relief rally. But $96 oil is still inflationary. Core CPI hasn't broken back under 3%. And the stagflation trade - the nightmare scenario where growth slows while inflation stays sticky - is firmly on the table.
Rate hike bets re-entering the market is uniquely bad for crypto for a mechanical reason. Bitcoin's risk narrative over the past three years has been built around two pillars: the halving supply shock, and the "rates are coming down" liquidity story. If rates go up instead of down, the second pillar collapses. The institutional allocation thesis - buy BTC as a hedge against monetary debasement - gets complicated when the Fed is actively tightening rather than easing.
// RATE HIKE RISK FACTORS
WTI oil at $96/bbl - still inflationary despite recent pullback from $108+
Gold peaked at $5,600 on Jan 29, now at $4,660 - safe haven rotation reversing
Nasdaq futures -0.6%, S&P futures -0.4% at time of writing
Iran conflict ongoing - any escalation pushes oil back toward $108+
Federal deficit spending at record levels - structural inflation floor
Gold's trajectory tells the story. The metal hit $5,600 in late January as geopolitical risk went parabolic. It's now at $4,660 - down 17% from peak. That's not a small correction. Gold selloffs of this magnitude typically coincide with one of two things: deflationary shock (risky assets collapse too) or a surprise pivot back toward risk appetite. Right now it looks like neither - equities are also under pressure, and Bitcoin hasn't made new highs.
Precious metals are retracing while risk assets struggle and geopolitics remain hot. This is the most difficult macro environment to navigate in years. There is no clean playbook for war, oil shock, tech sector pressure, and crypto fear simultaneously hitting at the same time.

The macro landscape as of March 22 - every major asset class showing stress signals simultaneously. Source: CoinDesk, Coinglass
Strategy's 89,618 BTC Quarter: Buying Into the Fear

Michael Saylor's Strategy continues to accumulate Bitcoin despite the price slide - Q1 2026 purchases have reached 89,618 BTC. Photo: Pexels
While retail traders panic-buy puts and hedge funds cut exposure, Michael Saylor's Strategy is doing what it always does: buying more Bitcoin.
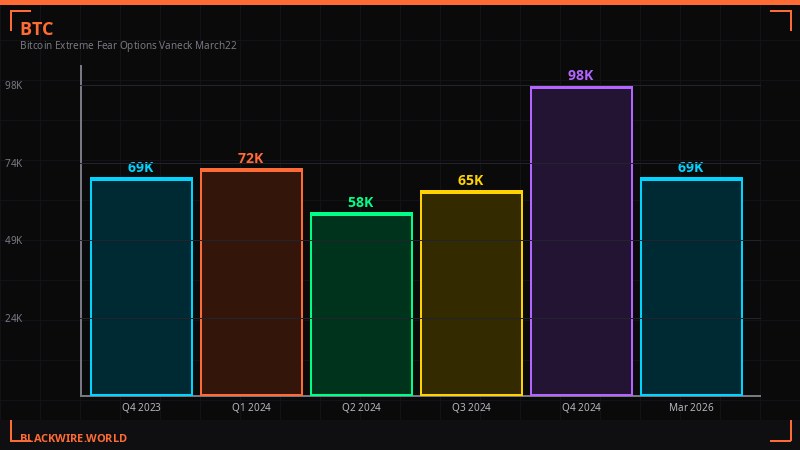
CoinDesk reported this week that Strategy is on pace for its second-biggest Bitcoin buying quarter on record. First-quarter purchases have reached 89,618 BTC so far, the largest single-quarter haul since Q4 2024. The quarter hasn't ended. They may still add more.
At an average price of roughly $88,000 per BTC - Strategy's blended cost basis - the company is currently sitting on a significant unrealized loss at $69,460 spot. But Saylor's thesis has never been about price timing. It's about accumulation. He views every price decline as an opportunity to lower the cost of future purchases, and he has a perpetual ATM machine in the form of at-the-money equity offerings and convertible notes to fund the buying.
"First-quarter purchases have reached 89,618 BTC so far, the most since fourth-quarter 2024, and the quarter is not yet over." - CoinDesk, March 2026
Strategy's balance sheet now holds approximately 500,000 BTC at various cost bases. The company has become the single largest non-ETF corporate holder of Bitcoin in the world. When Saylor buys this aggressively into a fear environment, it functions as a psychological anchor for institutional investors: the committed capital isn't leaving.
Morgan Stanley filed the same week to launch a spot Bitcoin ETF under the ticker MSBT with $1 million in seed capital at debut. The filing is preliminary - the SEC process will take months - but it signals that the largest wealth management shop in the United States is moving toward offering direct Bitcoin exposure to its clients. That is a structural demand driver that neither oil shocks nor options skew can easily override.
The institutional picture, in other words, is bifurcated. On one side: hedged, cautious, defensive positioning in derivatives. On the other: continued accumulation of spot exposure by strategic buyers. These two forces are in direct tension right now, which is exactly why Bitcoin can't break $75,000 and won't collapse to $50,000 either. The market is in a genuine tug of war.
The $20,000 Put Question: Who Buys This?

The $20,000 Bitcoin put option is the third most popular strike heading into quarterly expiry - nearly $600M in deep OTM puts signals tail-risk hedging. Photo: Pexels
The $20,000 Bitcoin put option is currently the third most popular strike by open interest heading into quarterly expiry. Nearly $600 million sits in deep out-of-the-money puts at that level, per CoinDesk data from March 19.
This sounds alarming until you understand the mechanics. Deep OTM puts serve two purposes in sophisticated portfolios: pure tail-risk insurance and volatility strategies. A $20,000 put with Bitcoin at $69,000 is approximately 71% out of the money. The probability of it expiring in the money in a normal market environment is very low. The premium is cheap. That makes it attractive as catastrophic insurance - the kind of position you buy not because you think $20K is likely but because if it happens, you want to be covered.
CoinDesk's analysis notes that the flows "point more to volatility strategies than to outright bearish bets." That is the critical distinction. A long straddle or strangle - owning both deep OTM puts and OTM calls - profits from a big move in either direction. If you think the Iran war could either escalate into a genuine regional conflict or resolve quickly with a ceasefire that sends oil crashing and risk assets ripping, you want exposure to both outcomes. Buying the $20K put and the $120K call simultaneously costs less than buying near-the-money options.
// VANECK CONTRARIAN SIGNAL WATCH
Signal: Put/call OI ratio at 0.84 - highest since June 2021
Historical pattern: 6 of the last 6 similar readings resolved with positive BTC returns at 90 days
Average 90-day return: +13%
Average 360-day return: +133%
Key risk to the signal: Novel macro backdrop (war, oil shock, rate hike bets) untested in prior data
Watch level: $68,500 (Binance liquidation heatmap critical level)
The quadruple witching event on March 20 - when stock index futures, stock index options, stock options, and single-stock futures all expire simultaneously - has historically been followed by Bitcoin weakness in the days and weeks after. The market is still digesting that expiry. The next major options expiry comes at end of March, and with nearly $600 million in $20K puts outstanding, the settlement dynamics will be watched closely.
For traders, the setup is this: the options market is pricing in fear at a level that has historically been wrong. But this time, there are legitimate macro catalysts - oil, war, rate hike bets - that could make the fear correct for the first time in six years. That uncertainty is exactly why the skew has gotten this extreme. Nobody knows which side is right. They're both buying protection.
What Happens Next: Three Scenarios

Three scenarios for Bitcoin in the weeks ahead - each driven by macro developments outside the crypto market. Photo: Pexels
The next few weeks for Bitcoin will be decided almost entirely by forces outside crypto. Three macro scenarios define the path forward.
Scenario 1: Iran ceasefire + oil drops to $80. This is the bull case. If diplomatic progress leads to a credible pause in hostilities, oil falls sharply, inflation fears recede, and rate hike bets get priced back out. Risk assets rally hard. The $600M in OTM puts expires worthless. VanEck's +13% call at 90 days looks prescient. Bitcoin pushes back through $75,000 and targets $85,000. The extreme put skew resolves as the contrarian signal it historically has been.
Scenario 2: War escalates, oil hits $120. The bear case. Iran counterstrikes, Strait of Hormuz becomes a flashpoint, oil spikes above $120 per barrel. Rate hike bets solidify into actual Fed action. The Nasdaq sells off 15-20%. Bitcoin's correlation with risk assets kicks in, and it follows equities down. $68,500 breaks, triggering the Binance liquidation cascade. Price tests the $55,000-$60,000 range. This is the scenario where the $20K puts aren't as crazy as they look.
Scenario 3: Prolonged uncertainty, no resolution. The sideways case. War continues at current intensity, oil stays in the $90-100 range, Fed jawbones about rates without acting. Bitcoin grinds between $65,000 and $75,000 for weeks. No major breakout, no major crash. Leveraged longs continue to get squeezed. Altcoins perform better than BTC on a relative basis. Institutional buyers like Strategy continue accumulating. This is arguably the most likely scenario based on current derivatives positioning - the market isn't pricing a 50% crash or a 50% rally. It's pricing volatility without direction.
The Wintermute analysis cited by CoinDesk earlier this week put it simply: investors are better off holding "dry powder" while prices swing wildly on headlines. Not a time for aggressive positioning in either direction. A time for patient capital and tight stops.
Bitcoin's realized volatility has dropped from 80 to 50 over the past two weeks, per CoinDesk. That's not nothing - lower realized vol means the market is actually less violent than it feels. The fear signal in options may be a lag indicator: traders hedging against the volatility they already experienced rather than accurately pricing what comes next.
The Strategic Picture: Institutional vs. Retail Divergence

Institutional and retail positioning has rarely been this divergent - one side buying puts, the other buying spot. Photo: Pexels
The most important structural observation of this market cycle is the divergence between institutional and retail behavior.
Institutions - Strategy, ETF flows, the Morgan Stanley filing - are buying or positioning to buy spot Bitcoin. They are betting on long-term value accumulation. They are not leveraged long. They can absorb a 30% drawdown without getting margin-called. Their time horizon is years, not weeks.
A large cohort of derivatives traders - the same sophisticated players who drive options volumes - are paying record premiums for downside protection. These are hedged portfolio managers, macro funds, and prop desks who have Bitcoin exposure they can't or won't sell but want to protect against a major drawdown. Their defensive positioning doesn't mean they're bearish long-term; it means they're protecting short-term against a known unknown: the macro wildcard.
Retail is somewhere in the middle. The altcoin season index at 46 suggests retail rotation into smaller caps is happening - that's a retail-driven dynamic. The QNT +7.5% on a Robinhood listing is retail. The FET +6.5% on AI narrative momentum is retail. Retail hasn't given up on the cycle.
Ripple data published this week showed stablecoins increasingly used for corporate treasury management - another structural demand signal. When companies are parking liquidity in USDT and USDC rather than T-bills, the on-ramp to crypto assets gets shorter. That is long-term bullish plumbing, regardless of what oil does this week.
The Gauntlet DeFi news is worth noting too: the risk management firm saw $380 million exit as OKX ended its crypto campaign. Gauntlet has been one of DeFi's most influential protocol risk consultants. Its client base shrinking is a signal that DeFi TVL growth has stalled and major exchanges are pulling back from deep DeFi integrations. Not catastrophic, but directionally important for anyone tracking the health of the DeFi sector.
The bottom line for March 22: Bitcoin is in genuine equilibrium between two powerful forces. The fear is real and the options data confirms it. But the buyers - institutional, strategic, systematic - are also real. This market doesn't resolve with a whimper. When the macro catalyst arrives, in either direction, the move will be fast and large. Position accordingly.
Get BLACKWIRE reports first.
Breaking news, investigations, and analysis - straight to your phone.
Join @blackwirenews on Telegram