Bitcoin's Triple Threat: Iran Ultimatum, Miner Bleed, and Record Options Fear
Three crises hit bitcoin simultaneously over the weekend. Trump threatened to blow up Iran's power grid. Miners are hemorrhaging $19,000 on every coin they produce. And the options market just registered its highest-ever fear reading. At $69,200, bitcoin is sitting on a knife's edge with a geopolitical deadline expiring Monday evening.
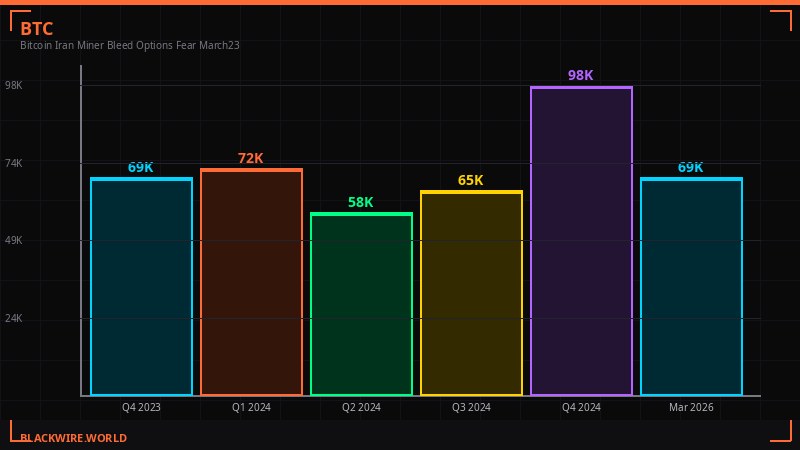
The week started with momentum. Eight consecutive days of gains had pushed bitcoin to $75,912 on March 19, riding a wave of ceasefire optimism and a dovish Federal Reserve pivot. The sentiment was building toward something constructive. Then Saturday arrived, and a single Truth Social post incinerated it.
U.S. President Donald Trump, who 24 hours earlier had described the military operation against Iran as "winding down," issued a 48-hour ultimatum demanding the reopening of the Strait of Hormuz - or face strikes on Iran's largest power plants. The swing from de-escalation to civilian infrastructure threats in one day whipsawed a market that had spent a week building confidence. The result: $299 million in liquidations, 84,239 traders wiped out, and bitcoin down 3.1% on the week as of Sunday morning. (Source: CoinDesk, CoinGlass, March 22, 2026)
The 48-Hour Clock: What Trump Actually Said

Trump's ultimatum was explicit. He would "hit and obliterate" Iran's power plants - beginning with the largest - if Iran didn't reopen the Strait of Hormuz to commercial shipping. The 48-hour window means the deadline lands Monday evening, right as U.S. markets open for the new week.
The Strait of Hormuz, for context, handles roughly 20% of the world's oil and gas flows. Since the conflict escalated, it's been effectively closed to most commercial traffic. That supply disruption helped push WTI crude above $100, a threshold with direct consequences for energy costs across the entire global economy - including bitcoin mining.
What makes this escalation particularly disorienting for traders is the speed of the reversal. On Friday, March 20, Trump was talking about winding down. By Saturday night, he was threatening civilian infrastructure. Markets had positioned around the former. They got blindsided by the latter.
"Going from winding down to threatening civilian infrastructure in 24 hours whipsawed a market that had spent the previous week building confidence around de-escalation." - CoinDesk Markets Analysis, March 22, 2026
The liquidation breakdown tells the story of the positioning. CoinGlass data shows $299 million in total liquidations over 24 hours across 84,239 traders. Long liquidations accounted for $254 million - 85% of the total. Bitcoin longs took $122 million in damage alone. Ethereum longs lost $95.7 million. The largest single liquidation was a $10 million BTC-USDT swap on OKX. The market wasn't just caught off-guard - it was leaning overwhelmingly bullish, maximally vulnerable to exactly this kind of shock.
Liquidation Damage - March 22, 2026
Iran has given no indication it plans to comply. The Islamic Republic has a playbook for these situations: public defiance followed by back-channel negotiations. But that playbook assumes the adversary is playing a standard geopolitical chess game. Threatening power plant strikes on civilian infrastructure is a different kind of move. The market can't price that scenario cleanly - it has no historical template for what comes next if Monday's deadline passes without compliance.
Major tokens fell in lockstep with bitcoin. Ether dropped 1.8% to $2,114. XRP lost 2.5% to $1.41. BNB slid 1.4% to $633. Solana fell 2.1% to $88.55. Dogecoin lost 2.7% to $0.092. The only two major assets showing green on the week were ether (+0.8%) and solana (+0.7%). Everything else is red over seven days as of Sunday morning. (Source: CoinDesk, March 22, 2026)
The Miner Bloodbath: $19,000 Under Water Per Coin

Before the Iran headlines, bitcoin miners were already in crisis. The war just made it worse.
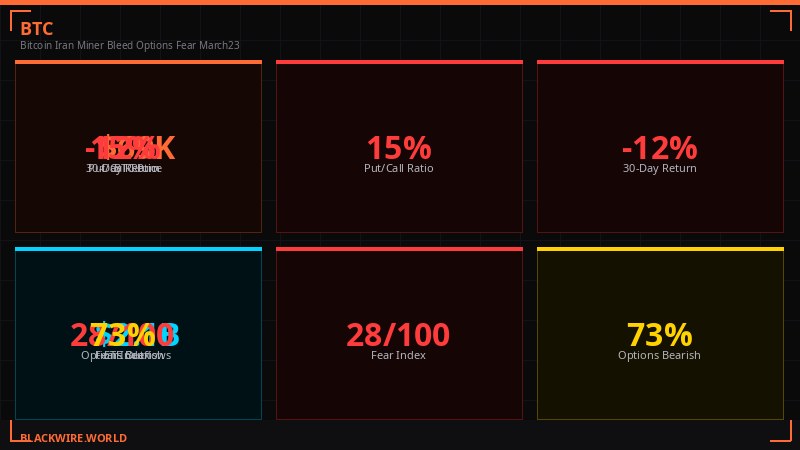
Checkonchain's difficulty regression model - which estimates average production costs based on network difficulty and energy inputs - pegged the average cost to produce one bitcoin at $88,000 as of March 13. Bitcoin was trading at $69,200 on Sunday. That's a gap of roughly $18,800. The average miner is operating at a 21% loss on every block they mine. (Source: CoinDesk, Checkonchain, March 22, 2026)
This cost squeeze has been building since October's crash took bitcoin from its $126,000 all-time high to below $70,000. But the Iran war has amplified every negative factor simultaneously. Oil above $100 per barrel feeds directly into electricity costs for mining operations. Roughly 8-10% of global bitcoin hashrate operates in energy markets sensitive to Middle Eastern supply. When the Strait of Hormuz closes, their electricity bills go up. When electricity costs rise, production costs rise. When production costs exceed the asset price, miners are forced to sell everything they mine just to survive.
Miner Crisis Metrics - March 2026
The difficulty adjustment on Saturday was the second-largest negative adjustment of 2026, dropping 7.76% to 133.79 trillion. Difficulty is now nearly 10% below where it started the year and far below November 2025's all-time high of approximately 155 trillion. Average block times stretched to 12 minutes and 36 seconds during the last epoch - well above the 10-minute target - signaling significant hashrate departure from the network. (Source: CoinDesk, Luxor Hashrate Index, March 22, 2026)
Hashprice - the metric tracking expected miner revenue per unit of computing power - is hovering around $33.30 per petahash per second per day according to Luxor's Hashrate Index. That's near breakeven for most hardware. The all-time low was $28, set on February 23. The current level isn't survivable for older, less efficient equipment, and those operations are already shutting down.
The public miners saw this coming and have been adapting. Marathon Digital, Cipher Mining, and others have been building out AI and high-performance computing data center capacity alongside their mining operations. The diversification thesis is simple: AI workloads provide more predictable revenue than mining bitcoin at a structural loss. The problem is that infrastructure buildouts take quarters, not days, and the pain is happening now.
"The network self-corrects by design, making it cheaper to mine as participants leave. But the period between when costs exceed revenue and when difficulty falls low enough to restore profitability is where the damage happens - both to miners and to the spot market that absorbs their forced selling." - CoinDesk Markets Analysis, March 22, 2026
The next difficulty adjustment is projected for early April and is expected to decline further based on CoinWarz data. If bitcoin stays below $88,000 - and there's no credible catalyst for that kind of recovery in the current environment - the miner exodus continues, difficulty keeps falling, and forced selling adds persistent supply pressure to the spot market. Mining economics have stopped being a sector-specific story. They're now a market structure story with direct implications for price action.
Options Market: The Fear Reading That Has No Historical Precedent

VanEck published its mid-March 2026 Bitcoin ChainCheck report, and the options data is unlike anything in their dataset. Traders are paying record prices for downside protection - a statistic that sounds abstract until you price what it means in dollar terms.
Bitcoin's 30-day average price fell 19% from the prior period, while realized volatility dropped from approximately 80 to just above 50. That sounds bullish - less realized movement means less fear in the actual price action. But the options market is telling a completely different story. The put/call open interest ratio averaged 0.77 and peaked at 0.84 - the highest level since June 2021, when China banned bitcoin mining and crashed the network's hashrate by 50%. (Source: VanEck Bitcoin ChainCheck Report, March 21, 2026)
Futures funding rates eased to 2.7% from 4.1%, confirming that leveraged speculation has cooled. Traders aren't piling into longs with borrowed money - they're buying insurance. Over the past 30 days, options traders spent approximately $685 million on put options while call premiums fell 12% to approximately $562 million. Relative to spot volume, put premiums reached roughly 4 basis points - an all-time high in VanEck's data.
VanEck notes: "Relative to spot volume, put premiums reached an all-time high of roughly 4 basis points - roughly 3x the levels seen in mid-2022 following the Terra/Luna stablecoin collapse and the Ethereum staking liquidity crisis." Institutional investors have never paid more for downside protection, relative to spot volume, in the entire history of bitcoin options markets.
For context, that 3x comparison to the Terra/Luna collapse period is significant. Luna was a $40 billion ecosystem implosion that wiped out stablecoin confidence globally, triggered cascading liquidations across DeFi, and destroyed multiple hedge funds simultaneously. Investors are currently buying more protection against bitcoin downside than they did during that period, relative to the size of the market.
VanEck's analysts add historical context that cuts the other way, however. The firm found that in the past six years, similar options-skewed readings - high put premiums relative to calls - were followed by average bitcoin gains of 13% over the subsequent 90 days and 133% over 360 days. That pattern suggests this kind of extreme fear has historically marked turning points rather than the start of fresh breakdowns. The catch is that past patterns assumed no active military conflict involving 20% of global oil supply disruption hanging over the market.
Ethereum's Multi-Front Structural Crisis
While bitcoin captures the headline numbers, ethereum is fighting a different kind of war - one that's less about price and more about survival as a coherent platform with a clear identity. Three separate crises converged in the first quarter of 2026, and the network's response reveals deeper fractures.
The scaling debate erupted in February when Ethereum co-founder Vitalik Buterin delivered a blunt verdict on the layer-2 ecosystem: "You are not scaling Ethereum." The comment cut through what had been a largely celebratory conversation about rollups - networks that process transactions off-chain and bundle them back to the base layer. Buterin's argument wasn't just that progress was slow. His concern was that many current L2 designs are drifting away from Ethereum's core model, relying on centralized components and creating siloed environments that don't fully inherit the security guarantees of the base chain. (Source: CoinDesk, February 3, 2026)
The fragmentation problem is real. Activity has spread across dozens of L2 networks. Fees have come down. But liquidity is fractured. Security assumptions vary by network. Users operating across the ecosystem face inconsistent guarantees. What looks like growth at the top level masks an ecosystem that may be splintering rather than scaling coherently. Ethereum, in trying to expand outward, risks losing the neutral settlement layer properties that made it valuable to institutions in the first place.
Layer 2 teams recalibrated. Some leaned into specialization - privacy, consumer apps, unique execution environments - rather than defending their role as cheaper Ethereum. Others pushed back more forcefully. The debate hasn't resolved. It's settled into a state of productive tension that may or may not translate into coordinated action before competitors like Solana capitalize on the confusion.
"The year ahead is likely to mark Ethereum's L2 consolidation: a leaner, more resilient layer anchored by ETH-aligned, exchange-backed, and high-performance networks." - 21shares Research Report, Q1 2026
Then came the quantum computing threat. The Ethereum Foundation elevated efforts like LeanVM and post-quantum signature schemes in February 2026, acknowledging what had been treated as a distant academic concern was now requiring near-term planning. Vitalik Buterin outlined a roadmap to protect the blockchain from long-term quantum computing risks. The implication is stark: the network isn't just building for the next market cycle, but for threats that could fundamentally break its cryptographic foundations. The Fusaka hard fork in December 2025 increased data capacity and efficiency on the main network, but quantum resistance requires a different class of upgrade entirely.
And then, at the worst possible moment, the Ethereum Foundation lost co-executive director Tomasz Stanczak to departure in February 2026. At a moment when the network faces simultaneous technical, strategic, and philosophical reevaluations, leadership continuity matters. The departure at the top signals internal tensions that haven't been fully disclosed publicly.
ETH is trading at $2,114 as of Sunday - down 1.8% on the day, but the one bright spot being a positive 0.8% weekly gain in a sea of red. The ETH/BTC ratio sits near multi-year lows, reflecting the market's growing preference for bitcoin as the base layer store-of-value play in a risk-off environment. ETH's narrative is more complex, requires more belief, and carries more execution risk - exactly the wrong profile when geopolitical uncertainty is dominating sentiment.
The Macro Crossfire: Fed, Oil, and the Stagflation Trap

The Federal Reserve held rates on Wednesday, March 19, with a dovish lean that should have been a tailwind for risk assets. Under normal conditions, a Fed hold with dovish signaling is bullish for bitcoin. Rates staying flat means less opportunity cost for holding non-yielding assets, less pressure on credit markets, and a signal that monetary tightening isn't back on the table. Markets briefly cheered - bitcoin tested $75,912 - and then the Iran escalation erased it all over the weekend.
The problem is that the Fed's dovish positioning collides with an oil price environment that creates stagflationary pressure. WTI above $100 per barrel is an inflation input that the Fed explicitly cannot ignore. If oil stays elevated because the Strait of Hormuz remains closed, the Fed faces a genuine dilemma: cut rates into an inflation-generating supply shock, or hold rates in an economy where energy costs are squeezing consumers and businesses simultaneously. That's not a situation monetary policy was designed to handle cleanly.
Gold has also been struggling in this environment despite being the traditional geopolitical hedge. Gold is nearing technical bear market territory as higher interest rate expectations and inflation pressures from rising oil prices reduce its appeal. On an M2-adjusted basis, gold is near historical peak levels, while bitcoin remains in what analysts describe as a typical consolidation phase. (Source: CoinDesk, March 20, 2026)
The macro setup for crypto is genuinely ambiguous. On one side: Fed dovishness, institutional accumulation, record-level regulatory clarity from the SEC/CFTC joint guidance published March 22, and the Senate's Clarity Act stablecoin compromise inching toward a floor vote. On the other: geopolitical uncertainty that won't resolve cleanly, mining economics that create structural sell pressure, and retail sentiment that is thoroughly beaten down. The week of March 22 is simultaneously the best regulatory environment bitcoin has ever operated in and the most hostile geopolitical environment since the crypto cycle began.
Strategy's Accumulation: The Institutional Floor Play
Against this backdrop of fear and uncertainty, one entity is still buying bitcoin aggressively. Strategy - formerly MicroStrategy - has reached 89,618 BTC in purchases for Q1 2026 as of March 21. That makes it on track for its second-biggest bitcoin buying quarter ever, behind only Q4 2024. The accumulation has continued despite BTC trading 45% below its November 2025 all-time high of $126,000. (Source: CoinDesk, March 21, 2026)
The firm's new STRC preferred shares structure has attracted both admiration and concern from analysts. The instrument functions as a novel bitcoin accumulation tool - essentially a way to raise capital that feeds directly into BTC purchases while offering investors a preferred equity instrument with complex risk/reward characteristics. Analysts at CoinDesk noted that the risks in STRC aren't as clearly communicated as the marketing suggests, but the accumulation engine itself is functioning as designed.
Strategy's continued buying at these levels provides a psychological floor for institutional participants. The logic is simple: if the world's largest corporate bitcoin holder is still buying at $69,200, the price isn't fundamentally broken. But there's a circular dependency risk here - Strategy's ability to continue buying depends on capital markets remaining open to its preferred share issuance, which depends on bitcoin's price not falling further, which depends partly on Strategy continuing to buy. The feedback loop works until it doesn't.
The firm has also become something of a cultural flashpoint. Access to Trump's crypto gala - tied to TRUMP memecoin holdings that qualify through timing and strategy rather than sheer volume - reportedly costs anywhere from $70,000 to several million dollars for a lunch conversation. (Source: CoinDesk, March 21, 2026) The financialization of political access through crypto instruments represents a new frontier for regulatory risk that hasn't been fully priced into the market.
What Comes Next: Monday's Deadline and the Decision Tree
The 48-hour clock expires Monday evening. The outcomes, and their market implications, branch sharply.
Scenario 1 - Iran Complies: The Strait reopens to commercial shipping. Oil prices fall immediately. Mining electricity costs decline. Macro fear premium in crypto prices dissipates. Short-covering rally likely takes BTC back toward $74,000-$75,000, potentially retesting the $75,912 weekly high. Options put premiums collapse as the geopolitical overhang lifts. This scenario requires Iran to reverse course publicly under explicit American military threats - historically unlikely within a 48-hour window.
Scenario 2 - Deadline Passes, No Strikes: Trump's ultimatum is called as a bluff. Markets briefly rally on relief, then reassess the geopolitical credibility deficit. Oil stays elevated. The Strait remains partially closed. No resolution in either direction. This is probably the most likely near-term outcome and the least destructive for crypto specifically, but it creates a persistent uncertainty premium.
Scenario 3 - Strikes on Iranian Power Plants: Civilian infrastructure gets targeted. This is the market's worst case. Oil spikes toward $115-$120 as the conflict escalates from naval blockade to active infrastructure war. Risk assets sell off hard globally. Bitcoin likely tests $65,000 support and potentially lower. Gold and the dollar benefit as safe-haven assets. The crypto options market, which is already pricing in extreme fear, would see further put premium escalation. Miner economics become unsustainably bad, forcing a wave of forced selling that compounds the price decline.
Market Decision Tree - Monday Deadline
The structural bull case for bitcoin remains intact underneath all of this noise. The regulatory environment - SEC/CFTC joint guidance, the Senate Clarity Act stablecoin deal, institutional adoption at scale - is categorically better in March 2026 than at any point in bitcoin's history. Strategy's Q1 accumulation pace suggests institutional conviction at current prices. VanEck's historical data shows that extreme fear readings have preceded significant rallies in six of the past six cycles.
But the miners are bleeding real money right now. The geopolitical deadline is real and expires in hours. And 43% of the total bitcoin supply is currently sitting at a loss - meaning nearly half of all market participants who own bitcoin are underwater and represent potential sellers on any relief bounce.
The week of March 23 opens with bitcoin caught between a historically strong regulatory tailwind and a historically severe combination of geopolitical risk, miner economic stress, and investor fear. The market has priced in a lot of bad news. What it hasn't priced in, because it can't, is which version of Monday night's deadline plays out. That answer comes within 24 hours.
Get BLACKWIRE reports first.
Breaking news, investigations, and analysis - straight to your phone.
Join @blackwirenews on Telegram