Bitcoin Miner Bloodbath: $19K Loss Per Coin as Iran Ultimatum Sends BTC Below $69K
The math is brutal and the war is making it worse. Bitcoin miners are bleeding $19,000 on every coin they produce while Trump's 48-hour ultimatum to Iran wiped out $299 million in leveraged positions overnight. This isn't a bad week. It's a structural collapse unfolding in slow motion.
KEY NUMBERS AT A GLANCE
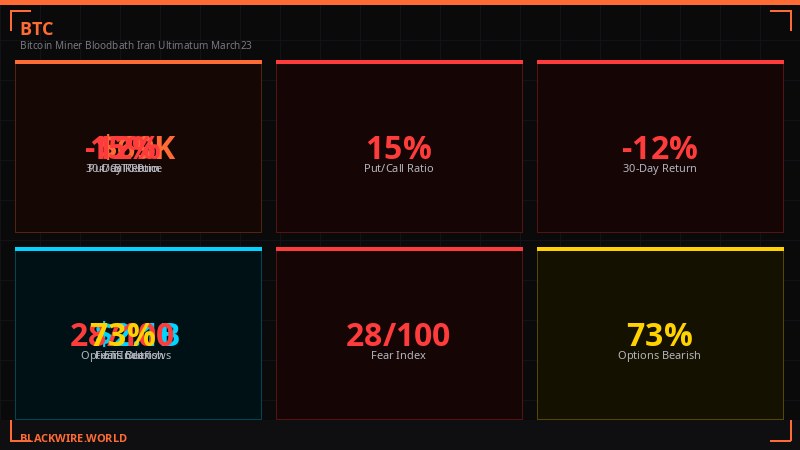
BTC Price: $69,200 (down 2.2% Sunday, down 3.1% on the week)
Average Mining Cost: $88,000 per coin (Checkonchain, mid-March)
Loss Per Coin: ~$18,800 (21% operating loss on every block)
Difficulty Drop: -7.76% to 133.79 trillion (second-largest 2026 adjustment)
Hashrate: ~920 EH/s (down from 1 zetahash record in 2025)
24h Liquidations: $299 million across 84,239 traders (85% longs)
Hashprice: $33.30/PH/day (near all-time low of $28 hit Feb. 23)
The Production Cost Trap
Checkonchain's difficulty regression model, which estimates average production costs based on network difficulty and energy inputs, pegged the figure at $88,000 per bitcoin as of March 13. Bitcoin was trading at $69,200 on Sunday, creating a gap of nearly $19,000 per coin.
That's a 21% operating loss on every block mined. Every ten minutes, somewhere in the world, a mining operation produces a coin and immediately books a five-figure loss. This has been true for weeks. The question isn't whether this is unsustainable - it obviously is. The question is how long miners can absorb it before the forced selling cascades.
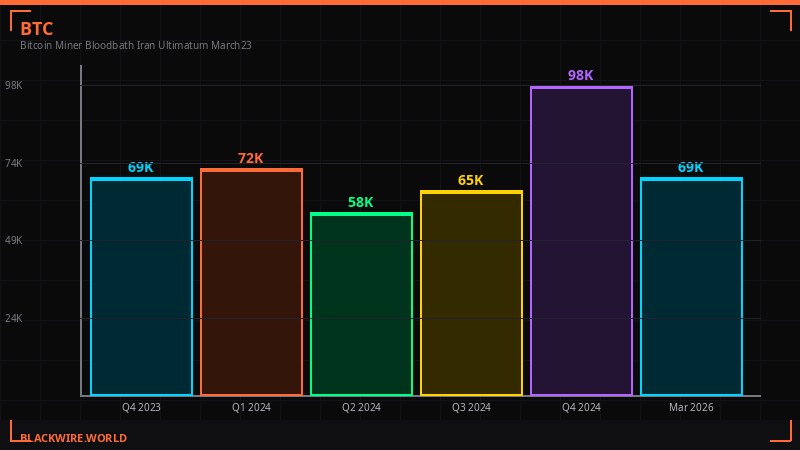
The cost squeeze didn't start with the Iran war. It started in October 2025, when bitcoin crashed from $126,000 to below $70,000 - a 44% collapse from the cycle peak that inverted the economics for most operations. What the war did was add an energy cost multiplier on top of an already painful situation.
Oil above $100 feeds directly into electricity costs for mining operations. According to CoinDesk data, an estimated 8-10% of global hashrate operates in energy markets with direct sensitivity to Middle Eastern supply disruptions. The Strait of Hormuz, which handles roughly 20% of the world's oil and gas flows, remains effectively closed to most commercial traffic since the conflict escalated at the end of February. Every extra dollar in oil is a cost input that doesn't move with bitcoin's price.
The public miners saw this coming. Marathon Digital, Cipher Mining, Core Scientific, and others have been aggressively diversifying into AI and high-performance computing over the past six months - chasing more predictable revenue streams that don't depend on bitcoin staying above production costs. But that pivot takes time and capital, and it doesn't help the mid-tier operators who built their entire business model around bitcoin at $100,000 or higher.
Network Stress: Hashrate, Difficulty, and the Self-Correction Trap
The network itself is showing the damage in the difficulty numbers. Difficulty dropped 7.76% on Saturday to 133.79 trillion - the second-largest negative adjustment of 2026 after February's 11.16% plunge during Winter Storm Fern. The February event was weather-related and temporary. This one is structural.
Bitcoin's difficulty is now nearly 10% below where it started the year and substantially below November 2025's all-time high of nearly 155 trillion. That record now looks like a peak that corresponded perfectly with the bitcoin price peak at $126,000. Both have retreated in lockstep.
Hashrate has pulled back to roughly 920 exahashes per second, a significant drop from the record 1 zetahash level reached in late 2025. Average block times during the last difficulty epoch stretched to 12 minutes and 36 seconds - 26% longer than the 10-minute target. That slowdown represents miners going offline, unable to cover costs, switching off hardware and waiting for conditions to improve.
Hashprice - the industry metric tracking expected miner revenue per unit of computing power - is hovering around $33.30 per petahash per second per day, according to Luxor's Hashrate Index. That's near breakeven for most modern hardware and only $5.30 above the all-time low of $28 hit on February 23, during the worst of the winter storm disruption.
Here's where the self-correction trap comes in. Bitcoin's protocol is designed to handle this: when hashrate drops and block times slow, difficulty adjusts downward, making it cheaper to mine. The network eventually reaches a new equilibrium where mining is profitable again at lower prices. But the period between when costs exceed revenue and when difficulty falls low enough to restore profitability is the damage window - and we're inside it right now.
The next difficulty adjustment is projected for early April, and CoinWarz data suggests another negative move is likely unless bitcoin's price recovers sharply. If miners continue to exit, the cycle continues: hashrate drops, difficulty drops after a lag, and in the meantime the operators who stay online absorb the losses or liquidate their holdings to fund operations. That selling adds supply to an already stressed spot market.
Trump's 48-Hour Ultimatum: How $299 Million Got Liquidated in One Weekend
The market had spent the previous week building a bullish narrative around potential de-escalation in the Iran conflict. Bitcoin hit $75,912 during the week - a strong intraweek recovery - and eight consecutive days of gains had pushed the majority of leveraged traders into long positions. Then Trump posted.
Late Saturday, President Donald Trump issued a 48-hour ultimatum to Iran: reopen the Strait of Hormuz to commercial shipping or face attacks on the country's power plants - "beginning with the largest." He specified he would "hit and obliterate" Iranian power infrastructure if the deadline passed without compliance.
The whipsaw was immediate and complete. On Friday, Trump had said he was thinking about "winding down" the military operation. Going from wind-down to threatening civilian infrastructure in 24 hours destroyed whatever confidence the market had built around de-escalation.
CoinGlass data shows $299 million in total liquidations over the 24 hours following the announcement, across 84,239 individual traders. Long positions accounted for $254 million - roughly 85% of the total damage. Bitcoin longs took $122 million alone. Ethereum longs lost $95.7 million. The largest single liquidation hit was a $10 million BTC-USDT perpetual swap on OKX, suggesting institutional-scale positions were caught in the move.
The lopsided ratio is the key data point. When 85% of liquidations are longs, it tells you the market was structurally positioned for upside. The traders who lost money weren't hedgers caught in a rally - they were bulls who got cleaned out by a geopolitical headline they didn't price in.
Major tokens fell in near-perfect correlation. Ethereum dropped 1.8% to $2,114. XRP lost 2.5% to $1.41. BNB slid 1.4% to $633. Solana fell 2.1% to $88.55. Dogecoin lost 2.7% to $0.092. The only majors showing any green on the week were Ethereum at +0.8% and Solana at +0.7%. Everything else was red across both 24-hour and 7-day frames.

The 48-hour window expired Monday morning. Iran has given no public indication it intends to comply. If Trump follows through on strikes against power infrastructure, it would represent the first direct targeting of civilian energy systems in the conflict - an escalation that would likely send oil to $120 or higher and hit crypto markets with another wave of risk-off selling.
Timeline: How We Got Here
Options Markets Are Screaming Fear - and History Says That's a Buy Signal

While the miner data and liquidation numbers paint a picture of acute distress, the options market is flashing something more nuanced. According to VanEck's mid-March 2026 Bitcoin ChainCheck, traders are paying record prices for downside protection - and historically, that level of fear has marked turning points rather than fresh breakdowns.
The put/call open interest ratio averaged 0.77 during the period and peaked at 0.84 - the highest reading since June 2021, when China's crackdown on bitcoin mining sent the market into a 50% drawdown. Traders spent approximately $685 million on put options over the past 30 days, while call premiums fell 12% to about $562 million.
"Relative to spot volume, put premiums reached an all-time high of roughly 4 basis points - roughly 3x the levels seen in mid-2022 following the Terra/Luna stablecoin collapse and the Ethereum staking liquidity crisis." - VanEck Mid-March 2026 Bitcoin ChainCheck
Four basis points of put premium relative to spot volume means investors are paying more for downside insurance, relative to market size, than at any point in bitcoin's options history. That's more fear than Terra/Luna. More fear than the 2022 bear market bottom. More fear than the China mining ban.
VanEck's analysts note that similar extreme fear readings in the past six years were followed by average bitcoin gains of 13% over 90 days and 133% over 360 days. The caveat is survivorship bias in the methodology, and the fact that none of those prior fear events occurred against the backdrop of an active Middle Eastern war with oil at $100+. This is historically unprecedented territory.
What the options data does confirm is that professional traders aren't positioned for a sudden rally. Futures funding rates eased to 2.7% from 4.1%, suggesting leveraged speculation has cooled significantly. Realized volatility dropped from around 80 to just above 50. The market is cautious, defensive, and waiting - not collapsing, but not recovering either.
The practical implication: if the Iran situation resolves, or even shows credible signs of de-escalation, the options positioning means there's a lot of potential upside pressure that could unwind quickly. A short squeeze of the defensive hedges could drive a sharp rally. If it gets worse - strikes on power infrastructure, wider conflict - the floor isn't clear.
Gold's Strange Failure and What It Means for Crypto

Gold's behavior in this conflict has been one of the stranger market anomalies of Q1 2026. The traditional safe-haven asset is approaching a technical bear market, down nearly 20% from its January all-time high. In a scenario that should be gold's perfect environment - active military conflict, energy disruption, geopolitical uncertainty - it has instead fallen roughly 10% since the war started at the end of February.
The explanation comes down to interest rates. Markets have repriced the rate outlook significantly, with Fed cuts largely pushed out and policy expected to remain restrictive through December 2026. Rising oil prices driven by the conflict are adding upward pressure on inflation - which reinforces the higher-for-longer rate environment. Gold doesn't yield anything, so when real rates rise, gold becomes less attractive relative to Treasuries. The geopolitical premium is being overwhelmed by the rate headwind.
When adjusted for M2 money supply, gold is trading near levels seen at major historical peaks in 1974 and 2011. On a liquidity-adjusted basis, it appears to be at or near a cyclical floor - which could mean consolidation before another leg up if rates eventually come down, or a genuine bear market if the inflation-rate dynamic persists.
Bitcoin's behavior relative to gold has been intriguing. The two assets have traded nearly tick-for-tick since gold broke down from $5,000 on Wednesday, showing elements of positive correlation after diverging earlier in the conflict. The correlation isn't new - during major liquidity events, bitcoin and gold both get sold - but it's notable that neither asset is functioning as the crisis hedge its proponents claim it to be.
On an M2-adjusted basis, bitcoin remains in a consolidation phase similar to 2024, while retesting its 2021 highs. Historically, each cycle has seen bitcoin move above prior peaks when adjusted for money supply. With bitcoin still about 40% below its October all-time high, the data point from CoinDesk and VanEck suggests a typical consolidation range before further upside - if the macro environment eventually allows it.
The conditional clause matters. "If the macro environment allows it" is doing a lot of work in a world where an active military conflict could escalate to strikes on civilian power infrastructure at any moment.
Ethereum's Existential Moment: Vitalik's Reality Check and the L2 Identity Crisis
While bitcoin's problems are primarily macro and market-structure driven, Ethereum is facing a different kind of crisis - one that goes deeper than price and into the fundamental question of what the network is actually trying to be.
Ethereum co-founder Vitalik Buterin delivered a sharp reality check to the broader ecosystem in February: "You are not scaling Ethereum." The comment cut through what had been a largely celebratory conversation around layer-2 rollups. These networks process transactions off Ethereum and bundle them back onto the main chain - in theory making the network faster and cheaper. Transaction fees have come down, activity has spread. But Buterin's argument was that the deeper architecture isn't delivering the kind of scaling Ethereum was meant to achieve.
"You are not scaling Ethereum." - Vitalik Buterin, February 2026
Buterin's critique identified a structural problem: many current layer-2 designs rely on centralized components and siloed environments that don't fully inherit the security guarantees of the base chain. The concern wasn't the existence of L2s - it was that in their current form, they may be delivering throughput while sacrificing the properties - security, decentralization, neutral settlement - that made Ethereum valuable in the first place.
The December 2025 Fusaka hard fork increased data capacity and efficiency on the main network, allowing more transactions to be processed while lowering costs. But that transaction spike came under scrutiny - some analysts flagged elevated volumes as potentially inflated by "address poisoning" scams rather than genuine economic activity. The network's metrics were better on paper than in practice.
Layer-2 teams responded to Buterin's critique in two ways. Some acknowledged the structural issues and pivoted toward specialization - privacy applications, consumer apps, unique execution environments rather than competing as generic cheaper-Ethereum. Others defended their approach, arguing high-throughput environments remain essential even if they compromise on decentralization.
The broader context: Ethereum's thesis for 2026 was that neobanks and institutional apps would onboard millions of users by abstracting away the complexity of wallets and gas fees - Ethereum as invisible infrastructure beneath consumer finance. That vision hasn't materialized on the timeline expected. Instead, the community is dealing with fragmentation across dozens of L2s, inconsistent security assumptions, and a base layer that's improved but still can't claim it's the neutral settlement layer it aspires to be.
Ethereum is down 1.8% on the Sunday session but up 0.8% on the week - the only major asset besides Solana with any positive weekly performance. That relative resilience is partly explained by the network's fee revenue holding up and institutional interest in ETF products staying consistent. But the structural identity questions Buterin raised don't resolve with a price move. They require architectural decisions that will take years to implement and validate.
What Happens Next: Three Scenarios for the Week Ahead
The 48-hour ultimatum expired Monday morning. Markets open in Europe and then the US with an unresolved question hanging over every risk asset: does Trump follow through, and if so, what does the escalation look like?
Scenario 1 - Iran Backs Down (Low Probability): Iran agrees to open the Strait under international pressure or back-channel negotiations. Oil drops toward $85, bitcoin rallies sharply back toward $75,000 as the short squeeze on defensive options positioning unwinds. This is the base case for the options market's implied upside potential, but Iran's track record and domestic political constraints make near-term compliance unlikely.
Scenario 2 - Ultimatum Expires Without Action (Medium Probability): Trump lets the deadline pass without a strike, either delaying or quietly reframing. Markets initially rally on the absence of escalation, then settle into a "wait and see" pattern. Bitcoin consolidates between $68,000 and $74,000. This scenario keeps the underlying structural problems - miner losses, options defensiveness, gold's weird failure - intact without resolution.
Scenario 3 - Strikes on Iranian Power Infrastructure (Medium-High Probability): The most dangerous scenario. Direct targeting of civilian energy systems would represent a major escalation beyond anything since the conflict began. Oil spikes toward $120-$130. Bitcoin takes another leg down, potentially testing $62,000-$65,000 as forced miner selling combines with risk-off liquidations. This scenario tests the "fear as a buy signal" thesis in a way none of the historical comparisons can prepare for.
The mining industry is watching this closely for a different reason. If oil goes to $120, the production cost model gets worse before it gets better. Difficulty will keep declining, but if energy costs rise faster than difficulty falls, the equilibrium never arrives. The most exposed operations - those in energy markets directly tied to Middle Eastern pricing - could face shutdown decisions in the coming weeks.
For the broader market, the miner selling dynamic is the slow-motion pressure that persists regardless of geopolitical headlines. When you have 43% of total bitcoin supply sitting at a loss, whales distributing into rallies, and the operators who produce new supply forced to sell just to cover costs, the bid side needs consistent institutional demand to absorb it all. That demand exists - Strategy (formerly MicroStrategy) is on track for its second-biggest bitcoin buying quarter, ETF inflows remain positive - but it's not infinite, and it's competing with a lot of motivated sellers.
The VanEck data showing record put premium ratios is either a contrarian buy signal or evidence that the professionals who watch this market most closely have decided the downside risks are real and worth paying to hedge. Both can be true at once. The Iran deadline is the most immediate catalyst. The miner economics are the structural drain. Watch both.
SOURCES USED IN THIS REPORT
- CoinDesk Markets: Bitcoin miner production cost and difficulty data (March 22, 2026)
- Checkonchain: Difficulty regression model, production cost $88K/BTC estimate
- CoinGlass: Liquidation data, $299M in 24 hours, 84,239 traders, 85% longs
- Luxor Hashrate Index: Hashprice $33.30/PH/day data
- VanEck Mid-March 2026 Bitcoin ChainCheck (Matthew Sigel et al.): Options fear analysis
- CoinDesk: Ethereum Fusaka upgrade coverage, Vitalik Buterin L2 critique (Feb 2026)
- CoinDesk: Gold vs Bitcoin macro analysis (March 22, 2026)
- CoinWarz: Next difficulty adjustment projections
Get BLACKWIRE reports first.
Breaking news, investigations, and analysis - straight to your phone.
Join @blackwirenews on Telegram