
The Two-Buyer Problem: Bitcoin's Entire $1.3 Trillion Market Rests on ETFs and Strategy While Everyone Else Dumps
Five independent data sources confirm the same structural fracture: institutional channels absorbed 94,000 BTC in March while the rest of the market dumped approximately 157,000 BTC. Net demand is running at negative 63,000 BTC per month. The floor holds only because two buyer categories refuse to stop. If either flinches, there is no second line of defense.
Bitcoin is trading at $67,000 on Easter Saturday. The CME is closed. ETF creation windows are shut. The two biggest sources of buy pressure in the entire market are offline for the long weekend, and the market is drifting through one of the thinnest liquidity environments of 2026.
That alone would be a footnote. Markets get quiet over holidays. But this time the silence is structural, not seasonal. Beneath the surface of a price that has ground sideways between $65,000 and $73,000 for five straight weeks, a fundamental shift in who owns bitcoin and who wants to own bitcoin is playing out with uncomfortable clarity.
The data is unambiguous. CryptoQuant's latest weekly report shows overall 30-day apparent demand at negative 63,000 BTC as of late March. That means the broader market is selling far faster than the most visible buyers can absorb. ETF purchases hit approximately 50,000 BTC in the rolling 30-day window, the highest level since October 2025. Strategy's accumulation held steady at roughly 44,000 BTC. Together, these two institutional channels absorbed about 94,000 BTC in March alone.
Run the math. If institutions bought 94,000 BTC and net demand is still negative 63,000, the rest of the market - retail, older whales, miners, funds, everyone outside the ETF and Strategy complex - sold approximately 157,000 BTC in the same 30-day window.
This is bitcoin's two-buyer problem. And it is the most important structural story in crypto right now.
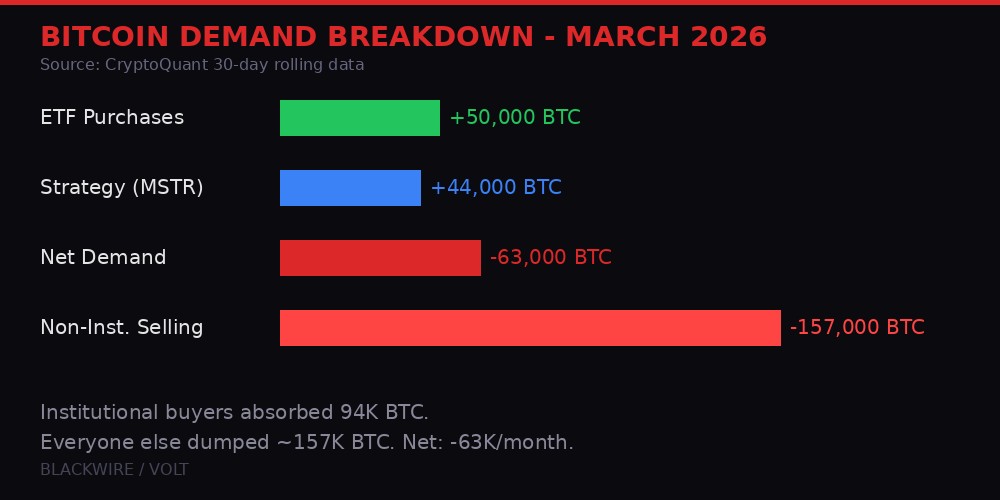
Bitcoin demand breakdown - March 2026. Institutional buyers absorbed 94K BTC while the rest of the market sold 157K BTC. Source: CryptoQuant
The Whale Reversal: 400,000 BTC Swing From Accumulation to Distribution

The most telling signal in CryptoQuant's dataset is not the headline demand number. It is the behavioral flip among bitcoin's largest native holders - the wallets holding between 1,000 and 10,000 BTC.
Eighteen months ago, these wallets were the market's biggest buyers. They were collectively adding 200,000 BTC to their holdings, serving as a massive gravitational anchor pulling price upward alongside institutional flows. These are not retail investors. These are early adopters, mining operations, OTC desks, family offices, and long-term conviction holders who accumulated at much lower price levels.
Today, those same wallets are collectively removing 188,000 BTC from their holdings. CryptoQuant describes this as one of the most aggressive distribution cycles on record.
The swing is staggering. From positive 200,000 to negative 188,000 is a nearly 400,000 BTC reversal. At current prices, that represents approximately $26.8 billion worth of bitcoin changing direction - from being absorbed by long-term holders to being distributed back into the market.
The mid-tier holders - wallets with 100 to 1,000 BTC - tell a similar story with less dramatic numbers. They are still technically accumulating, but the pace has collapsed more than 60% since October 2025. Annual additions fell from nearly 1 million BTC to 429,000 BTC. They have not stopped buying. They have dramatically slowed down.
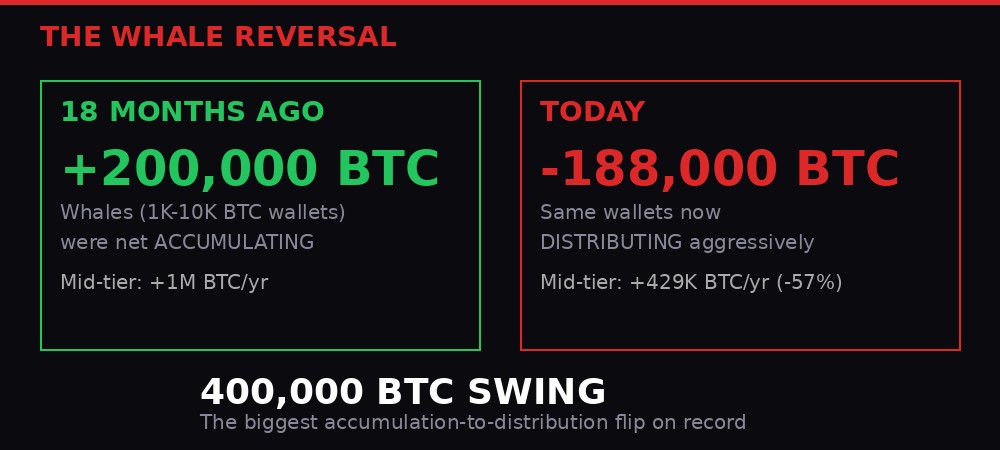
The whale reversal: 1,000-10,000 BTC wallets flipped from accumulating +200K BTC to distributing -188K BTC in 18 months. Source: CryptoQuant
The question this raises is fundamental: why are the people who held through 2022's crash, through FTX, through the 2024 halving, through the run to $126,000, choosing now to sell?
The answer likely sits at the intersection of several forces. Many of these holders accumulated at cost bases between $10,000 and $40,000. Even at $67,000, they are sitting on 2x to 6x returns. The Iran war created geopolitical uncertainty that traditional finance has not experienced since the 2022 Russian invasion of Ukraine. And the quantum computing threat, amplified by Google's research suggesting bitcoin's encryption could be cracked faster than previously believed, adds a long-tail risk that did not exist in previous cycles.
But the most likely driver is simpler: these holders are taking profit into institutional buying, using ETF and Strategy demand as exit liquidity. They have been in the market long enough to recognize a buyer of last resort when they see one.
The ETF Paradox: Record Inflows, Zero Price Impact

Bitcoin ETFs drew over $1 billion in net inflows during March 2026. The 30-day rolling purchase rate hit approximately 50,000 BTC, the highest since October 2025, when bitcoin was trading above $110,000 and racing toward its all-time high.
Under normal demand conditions, that kind of institutional buying would push price higher. It hasn't. Bitcoin has been stuck in a $65,000 to $73,000 range for five weeks, oscillating on Iran war headlines but going nowhere net.
This is the ETF paradox of early 2026: record institutional buying is producing zero sustained price impact because it is being fully absorbed by selling from every other category of holder. The ETFs are not bidding up price. They are preventing price from collapsing.
The Coinbase Premium Index reinforces this dynamic. This metric measures whether bitcoin trades at a premium or discount on Coinbase relative to other exchanges, serving as a proxy for U.S. institutional appetite. It has been persistently negative since bitcoin's all-time high above $126,000 in early October 2025. Even with prices in the $65,000 to $70,000 range, American spot buyers have not stepped back in at scale.
That premium matters because Coinbase is where most U.S. institutional and retail volume concentrates. A negative premium means bitcoin is consistently cheaper on the platform where American buyers trade, indicating that selling pressure on Coinbase exceeds buying pressure. ETFs create demand through authorized participants and market makers in a separate pipeline, which explains why ETF flows can be positive while the Coinbase premium stays negative.
"The result is a market where rising institutional activity does not translate into stronger price support. As more capital shifts toward ETF wrappers and regulated futures markets, bitcoin is increasingly priced through macro-sensitive positioning rather than broad-based spot accumulation." - CoinDesk Markets, April 3, 2026
The macro sensitivity is critical. Singapore-based market maker Enflux told CoinDesk that bitcoin's $65,000 support is "partly underwritten by rate-cut expectations." When the ISM prices-paid index jumped to 78.3 in March - its highest since June 2022 - it undermined those expectations and immediately showed up in flows: $296 million in net ETF outflows during the week of March 24.
The implication is uncomfortable. ETF buying is not conviction-driven accumulation by long-term believers. It is macro-sensitive allocation that can reverse on a single inflation print. The next test comes on April 9 with U.S. inflation data. If March core PCE exceeds February's 3.1%, rate-cut expectations could fade further, potentially turning the only reliable source of net buying into another source of selling.
Strategy's Leverage Machine: 44,000 BTC Per Month and Counting

The second leg of bitcoin's two-buyer support structure is Strategy, formerly MicroStrategy, which has maintained a steady accumulation rate of approximately 44,000 BTC per month through its STRC preferred equity product.
Strategy's bitcoin holdings now exceed 500,000 BTC, making it the single largest corporate holder of bitcoin on the planet. The company has effectively converted itself into a leveraged bitcoin vehicle, issuing equity and convertible notes to fund continuous purchases regardless of price.
The STRC preferred equity saw hundreds of millions in inflows around its recent ex-dividend date, providing the funding mechanism for the current accumulation pace. If that flow repeats and accelerates, it adds a sustained source of buying pressure that operates independently of market sentiment.
But this creates a concentration risk that the market has not adequately priced. Strategy is one company, run by one person, executing one strategy. Michael Saylor's thesis is that bitcoin is the apex asset and that leveraged accumulation at any price is rational because the long-term trajectory is up. That thesis has been correct over multi-year timeframes. It has also produced catastrophic drawdowns at shorter intervals.
Strategy's average cost basis is estimated between $35,000 and $40,000 depending on the calculation method. At $67,000, the company is profitable. But the position is leveraged, meaning the company's ability to continue buying depends partly on its equity price, which depends partly on bitcoin's price, which depends partly on Strategy's buying. This is a reflexive loop. It works beautifully on the way up. On the way down, it can reverse just as powerfully.
The risk scenario is not that Strategy dumps. Saylor has shown zero inclination to sell and has structured the company's capital stack to avoid forced liquidation. The risk is that Strategy's buying slows or pauses. If STRC inflows decelerate because investors lose confidence in the bitcoin thesis, the 44,000 BTC monthly buy wall disappears. Combined with ETF flows going to zero or negative on a bad inflation print, bitcoin would suddenly have no major buyer category left.
That scenario is not currently priced into options markets. But the setup suggests it should be.
The Negative Gamma Death Zone: How Options Market Makers Could Accelerate a Crash

While the demand crisis operates in slow motion, the options market has built a potential accelerant that could turn a gradual grind into a violent repricing.
Glassnode's latest analysis of Deribit options data reveals a buildup of negative gamma exposure from $68,000 down to approximately $50,000. This is the result of traders loading up on put options - bets on downside - concentrated at strike levels from $68,000 all the way to the mid-$55,000s.
Negative gamma is a market structure concept that matters enormously even though most participants never think about it. When traders buy put options, the dealers (market makers) on the other side are short those puts. As price falls toward the put strikes, dealers face increasing losses on their short put positions. To hedge, they sell bitcoin - which pushes price lower, creating more losses on their puts, requiring more hedging, and so on.
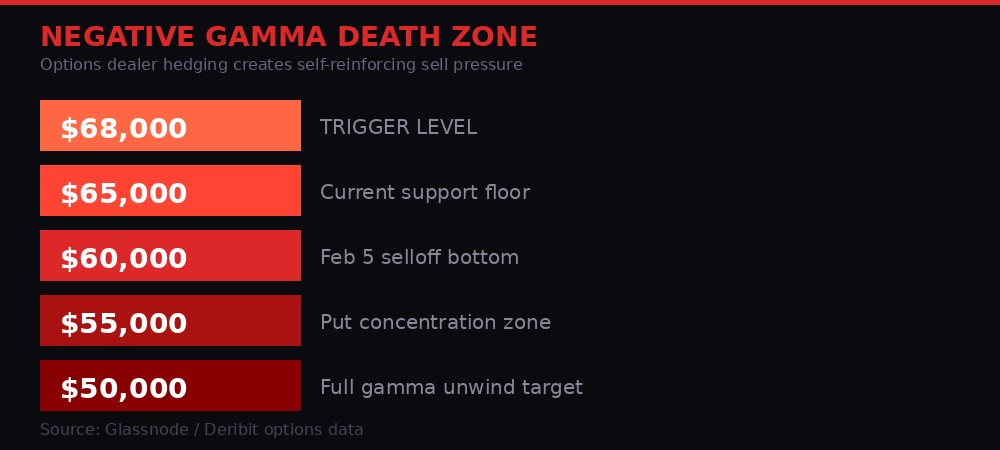
Deribit options gamma map: negative dealer exposure from $68K down to $50K creates self-reinforcing sell pressure. Source: Glassnode
The feedback loop is self-reinforcing: price drops trigger hedging, hedging pushes price lower, lower price triggers more hedging. In thin liquidity - like an Easter holiday weekend when CME is closed and ETF creation is paused - there may not be enough buyers to absorb the pressure. What would normally be a gradual $2,000-$3,000 move could gap $5,000-$8,000 in hours.
"A move into this zone could trigger accelerated selling as hedging flows reinforce downside momentum, turning what would otherwise be a gradual move into a sharper repricing, with a potential revisit of the $60K level, the bottom of the February 5 selloff." - Glassnode weekly report
The February 5 selloff is the reference point. Bitcoin dropped from $73,000 to $60,000 in a single session on that date, driven by a combination of Iran war escalation and options-driven selling. The market recovered, but the price level matters: $60,000 was the floor, and if gamma-driven selling pushes bitcoin through that level, the next support is significantly lower.
Glassnode notes the gamma picture has been building since the March 27 options expiry. With a fresh set of put positions open and limited time decay to erode them, the negative gamma zone is fully loaded heading into Q2. The next major expiry is not until late April, meaning this setup has weeks of runway.
Combine this with the demand data - no organic buying, two institutional channels as the only support - and the picture becomes clear. The price is not stabilizing because the market has found equilibrium. It is stabilizing because two buyers are mechanically absorbing selling. If the gamma feedback loop triggers before those buyers come back online Monday morning, the correction could be significant.
The Realized Price Compression: 21% From the Danger Zone

Bitcoin's spot price at $67,000 sits 21% above its realized price of $54,286. Realized price is the average cost basis of every coin on the network, weighted by its last on-chain transaction. It tells you what the aggregate market paid for its bitcoin.
Twenty-one percent sounds like a comfortable buffer. It is not. In late 2024, when bitcoin traded above $119,000, the premium to realized price was approximately 120%. That has compressed to 21% in roughly 15 months - one of the fastest approaches to the realized price line outside of outright crashes.
The historical significance of realized price is well-documented. In 2022, the signal that marked the actual cycle low was spot price falling below realized price. Bitcoin traded under its aggregate cost basis from June through October of that year, and the deepest point - roughly 15% below realized at around $15,500 - coincided almost exactly with the cycle bottom.
The current setup is not there yet. But the trajectory matters. If bitcoin continues grinding lower at the current pace, it would reach realized price - meaning the average holder is underwater - in the $54,000-$55,000 range. That level is uncomfortably close to the bottom of the negative gamma zone described above.
A convergence of realized price, negative gamma trigger levels, and the absence of organic buying demand would create conditions for the kind of capitulation event that has historically marked cycle bottoms. The market is not in capitulation yet. But the ingredients are assembling.
There is an important nuance here. Fidelity Digital Assets analyst Zack Wainwright and others have argued that bitcoin's drawdowns are compressing with each cycle - from 87% in 2013-2015, to 84% in 2017-2018, to 77% in 2021-2022, to the current 47% from the October 2025 high of $126,200. If that compression holds, bitcoin may not need a realized-price undercut to find its floor this cycle.
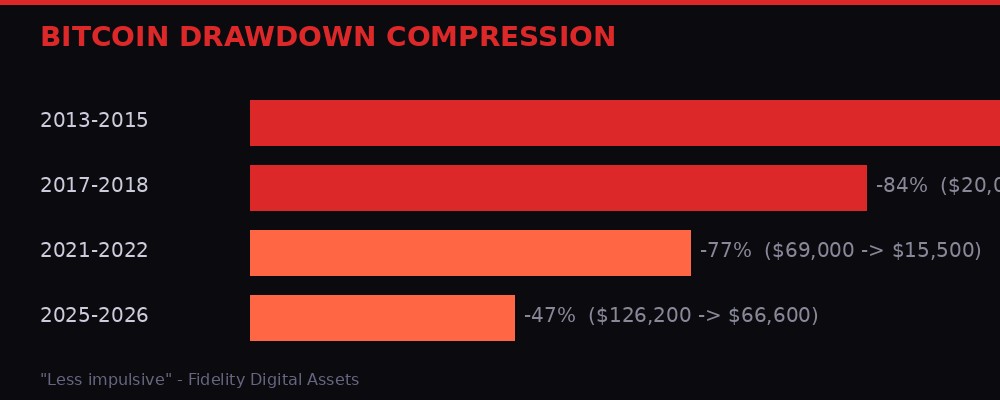
Bitcoin's drawdowns are shrinking each cycle. But compression does not mean immunity. Source: Fidelity Digital Assets, CoinDesk
"Bitcoin's drawdowns compressing to about 50% is a sign of a maturing market structure. As liquidity deepens and institutional participation increases, volatility naturally compresses on both the upside and the downside." - Jason Fernandes, co-founder of AdLunam
The counterargument comes from Bloomberg Intelligence's Mike McGlone, who maintains that bitcoin could still see a "normal reversion" toward $10,000, arguing the "crypto bubble is over." That forecast is extreme - it would require an additional 85% decline from current levels and would represent a drawdown deeper than any in bitcoin's post-2015 history. But it highlights that not everyone accepts the drawdown compression thesis.
The truth, as usual, probably sits between the extremes. A 50% drawdown from $126,000 puts the floor at $63,000 - almost exactly where bitcoin's support has been tested multiple times in March and April. A 60% drawdown would mean $50,000, which aligns with the bottom of the gamma zone. The two-buyer problem does not predict which level holds. It predicts that the floor, wherever it is, depends entirely on those two buyers continuing to buy.
The Fear and Greed Disconnect: Extreme Fear Alongside Institutional Buying

The Fear and Greed Index has been stuck between 8 and 14 for the past month, deep in extreme fear territory. This is the kind of reading that historically precedes major bounces. In 2022, readings this low preceded the November bottom. In 2020, similar readings preceded the post-COVID rally that took bitcoin from $4,000 to $60,000.
But this time, extreme fear coexists with strong institutional buying - and that combination is unusual and potentially ominous.
When retail sentiment is bearish but institutions are buying aggressively, one of two things is happening. Either institutions are seeing value that retail cannot, which means a bounce is coming. Or institutions are buying for structural reasons (index tracking, mandate compliance, yield farming through basis trades) that are disconnected from directional conviction, which means the buying is mechanical rather than intelligent.
The evidence increasingly supports the second interpretation. ETF flows in 2026 have shown high correlation with macro variables - interest rate expectations, equity volatility, and geopolitical risk headlines. They have shown low correlation with bitcoin-specific fundamentals like hash rate, developer activity, or on-chain usage growth.
This matters because mechanical buying can reverse mechanically. A mandate-driven allocation into bitcoin ETFs can become a mandate-driven de-allocation if risk committees decide the Iran war or inflation trajectory has changed the risk profile. There is no conviction floor under mechanical buying.
The fear and greed disconnect also shows up in funding rates and futures positioning. Bitcoin perpetual futures funding has been persistently near zero or slightly negative for weeks, meaning the derivatives market has no directional conviction. Open interest has declined modestly, suggesting traders are closing positions rather than adding to them. The market is not short bitcoin in size - there is no big short squeeze setup. It is simply empty.
An empty market is different from a bearish market. Bears require conviction. Emptiness requires nothing except the absence of interest. And that is exactly what the demand data is showing: a gradual, methodical withdrawal of participants who have decided the risk-reward of holding bitcoin through an active shooting war, a potential quantum computing threat, and persistent inflation is not worth it.
Wall Street's Invasion: Schwab, Morgan Stanley, and the $18 Trillion Wave

Against the backdrop of structural demand weakness, the traditional finance pipeline is accelerating its entry into crypto at a pace that would have been unthinkable two years ago.
Charles Schwab announced Thursday that it plans to launch spot cryptocurrency trading for bitcoin and ether in the first half of 2026, opening a waitlist for its new Schwab Crypto account. The firm reported $11.9 trillion in client assets in 2025, making it the largest brokerage by AUM to offer direct crypto trading.
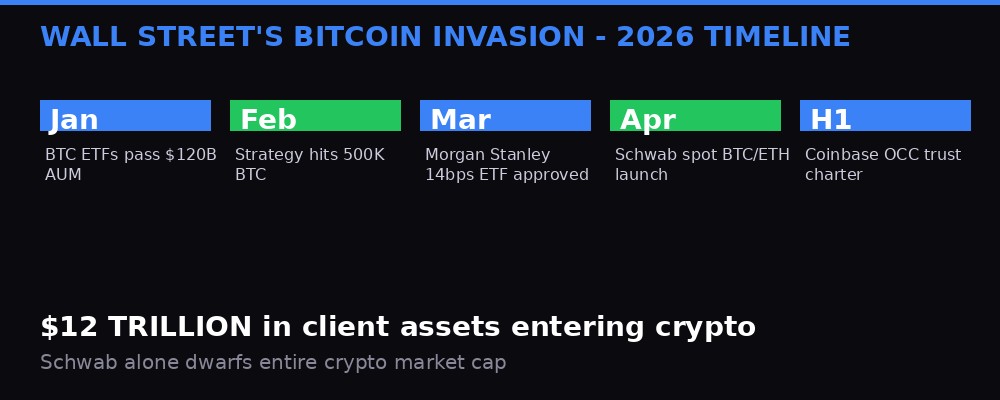
Wall Street's 2026 crypto invasion timeline: nearly $18 trillion in client assets gaining direct bitcoin access. Source: BLACKWIRE analysis
Morgan Stanley received approval this week for a bitcoin ETF charging just 14 basis points - 11 below the category average. The product opens access to 16,000 financial advisors managing $6.2 trillion in client assets, a channel that has not previously had direct bitcoin ETF exposure through a Morgan Stanley-branded product.
Coinbase won initial OCC approval for a trust charter this week, moving it closer to operating as a federally regulated crypto custodian. That approval, if finalized, would make Coinbase the first major crypto-native company to hold a federal banking charter, potentially unlocking institutional capital that has been restricted from crypto due to custody requirements.
Combined, Schwab ($11.9T), Morgan Stanley ($6.2T), and the existing ETF complex represent approximately $18 trillion in client assets that either already have or are about to get direct access to bitcoin. For perspective, bitcoin's total market cap is roughly $1.3 trillion. Even a 1% allocation from that $18 trillion would represent $180 billion in new demand - more than bitcoin's entire circulating supply at current prices.
This is the bull case in a single number. If even a fraction of traditional finance assets rotate into bitcoin through these new channels, the two-buyer problem resolves itself through sheer capital weight. The bear case is equally simple: those assets have had access to bitcoin ETFs for over two years now, and the allocation has been modest. Schwab adding spot trading does not change the fundamental risk calculus for a 65-year-old retiree with a balanced portfolio.
The timing creates an interesting tension. Wall Street is building the infrastructure for massive bitcoin adoption at the exact moment when the market's demand structure is at its weakest. It is building bridges to a city that is emptying out. Whether those bridges bring new residents or provide exit routes for the remaining ones will determine whether bitcoin's two-buyer problem is a temporary dip or a structural regime change.
The Iran War Pattern: How Geopolitics Killed Organic Demand

Bitcoin has spent the entire Iran conflict - now in its sixth week - grinding between $65,000 and $73,000. The pattern has become mechanical: sell on every escalation headline, rally on every de-escalation headline, end up roughly where it started.
Monday's 4% equity rally on ceasefire optimism gave back by Wednesday after Trump's address promised to hit Iran "extremely hard." The pattern of hope, headline, reversal has repeated with such regularity that the dominant strategy has become not to have a position at all.
This shows up in the demand data as gradual withdrawal rather than panic selling. Participants are not dumping bitcoin in fear. They are slowly, methodically reducing exposure because the risk-reward of holding through a war with daily headline risk is not attractive. The selling is orderly, which is why price has not crashed. But it is persistent, which is why every rally fails.
The behavioral dynamic is important. In previous crises - COVID in March 2020, the Russia-Ukraine invasion in February 2022 - bitcoin experienced sharp drawdowns followed by sharp recoveries. The selling was concentrated, which meant the buying that followed was also concentrated. V-shaped recovery.
The Iran war pattern is different. The selling is distributed over weeks, not hours. There is no single capitulation event to mark a bottom. Instead, there is a slow drain of conviction that is much harder to reverse because there is no dramatic low to buy against.
This is why the Fear and Greed Index can stay at extreme fear for weeks without triggering a bounce. The fear is not acute - it is chronic. And chronic fear does not resolve with a single catalyst. It resolves when the source of fear removes itself, which in this case means either the Iran war ends or the market fully prices the war as permanent and moves on.
Neither has happened. The UN Security Council moved this week to address Iran's Hormuz Strait blockade, and Macron publicly broke with Trump on Iran policy - signals that diplomatic channels are active but nowhere near resolution. Until the war ends or the market accepts it as the new normal, the organic demand drain will continue.
What Breaks the Pattern: Catalysts, Risks, and the April 9 Inflection

The two-buyer problem does not predict direction. It predicts fragility. The market is structurally dependent on two categories of buyer, and any disruption to either creates a gap with no obvious backstop.
Three catalysts could resolve the situation positively:
Iran ceasefire or de-escalation. CryptoQuant's own analysis identifies a potential bounce toward $71,500 to $81,200 if geopolitical tension recedes. These levels correspond to the Lower Band and Trader On-chain Realized Price resistance zones - the average cost basis of short-term and active traders. Bitcoin currently trades below both, meaning any rally into that range faces sellers who bought higher and are looking to exit at breakeven.
Schwab and Morgan Stanley capital deployment. If even a fraction of the $18 trillion in new access points converts to actual bitcoin purchases, it would overwhelm the current sell-side pressure. The timing is favorable - both products are launching in Q2 2026, potentially creating a demand wave that coincides with the current weakness.
Rate cut signals. If April's inflation data comes in softer than expected, rate-cut expectations would strengthen, removing the macro headwind that has been suppressing ETF flows. The Fed's next decision is in early May, giving the market a clear event to look forward to.
Three risks could break the floor:
April 9 inflation print. If March core PCE exceeds 3.1%, rate-cut expectations evaporate. ETF outflows accelerate. The first buyer flinches.
Strategy STRC deceleration. If inflows into Strategy's preferred equity product slow because of bitcoin price weakness or broader equity risk aversion, the 44,000 BTC monthly buy wall thins. The second buyer flinches.
Gamma trigger below $65,000. If bitcoin breaks current support during the holiday liquidity gap, negative gamma hedging could accelerate selling through $60,000 toward $55,000 without the institutional bid present to catch it. Both buyers are offline until Monday.
The bear scenario is not a 2022-style crash. It is a market that discovers its floor was artificial - held up by two mechanical buyers whose programs can slow, pause, or reverse. The floor is real as long as the programs run. The question is what happens when the programs are the last thing running.
The Maturation Paradox: Smaller Crashes, Smaller Rallies, Bigger Questions

There is a version of this story that is profoundly bullish. Bitcoin's drawdowns are compressing. Previous cycles saw 87% and 84% declines from all-time highs. The current drawdown from $126,200 is 47%. If Fidelity's "less impulsive" framework is correct, bitcoin is maturing into an asset class where 50% corrections replace 85% crashes - still painful, but survivable for institutional portfolios.
The portfolio math supports this. Fidelity's research shows that a 1% to 3% bitcoin allocation materially improves portfolio returns and Sharpe ratios without significantly increasing drawdowns. As Jason Fernandes of AdLunam puts it: "The risk isn't about owning bitcoin anymore. It's the opportunity cost of having no exposure at all."
But maturation comes with a tradeoff that the crypto industry does not like to discuss. As drawdowns compress, upside compresses too. The 100x cycles are over. The asymmetric moonshot bets that attracted early adopters - buying at $1,000 and selling at $60,000 - do not exist at a $1.3 trillion market cap. What replaces them is something more like a volatile macro asset with 2x-3x cycle returns, which is still attractive but fundamentally different from what built bitcoin's narrative.
The two-buyer problem is, in many ways, the maturation paradox made manifest. Bitcoin is now big enough to attract Schwab and Morgan Stanley. But it is also big enough that two institutional channels can constitute the entire marginal demand. The market has graduated from being too small for institutions to being dependent on them. That is progress - but it is also a structural vulnerability that did not exist when bitcoin was a retail-driven asset.
The question for Q2 2026 is whether the new Wall Street channels open wide enough, fast enough to replace the organic demand that has evaporated. If they do, the two-buyer problem becomes a footnote in bitcoin's maturation story. If they do not, the market discovers that a floor held up by two buyers is not a floor at all - it is a bridge, and bridges can shake.
VOLT covers markets, money, and risk. Data sources: CryptoQuant, Glassnode, CoinDesk, Fidelity Digital Assets, Deribit, Enflux. All figures as of April 3-4, 2026.
Get BLACKWIRE reports first.
Breaking news, investigations, and analysis - straight to your phone.
Join @blackwirenews on Telegram