Blood in the Water: Half of All Bitcoin Is Underwater While Wall Street Loads the Boat

The numbers don't lie. But they're telling two completely different stories. (Pexels)
Something is deeply, structurally wrong with the Bitcoin market right now. Or something is deeply, structurally right. It depends entirely on which side of the trade you're sitting on.
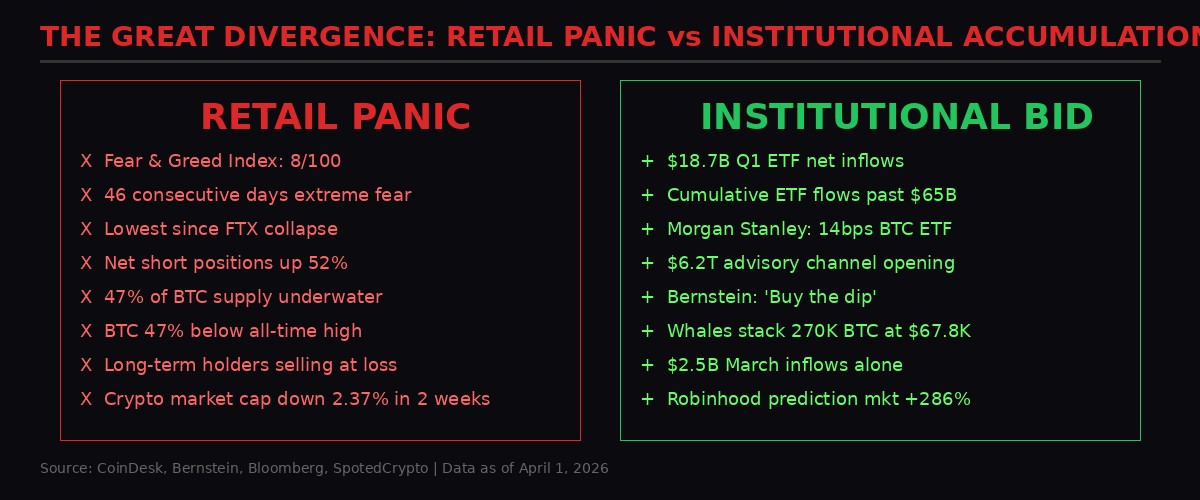
As Q2 opens on April 1, 2026, the crypto market presents what might be the most extreme divergence in its 17-year history. On one side: 47% of all Bitcoin in existence is sitting at a loss. The Fear and Greed Index has been pinned at single digits for 46 consecutive days - the longest streak of extreme fear since the FTX collapse. Retail traders are capitulating en masse, short positions have surged 52%, and the Bitcoin Impact Index just hit 57.4, a reading that preceded 25%+ drops in both 2018 and 2022.
On the other side: spot Bitcoin ETFs absorbed $18.7 billion in Q1 alone, pushing cumulative inflows past $65 billion. Morgan Stanley just filed for a Bitcoin ETF at 14 basis points that would open a $6.2 trillion advisory channel. Bernstein is telling every client in earshot to buy the dip. And whales have quietly stacked 270,000 BTC at an average price of $67,800.
One of these groups is catastrophically wrong. The question that will define Q2 is which one.
The Underwater Map: 47% of All Bitcoin Held at a Loss
Nearly half of all Bitcoin in circulation is now worth less than its purchase price. (BLACKWIRE/VOLT)
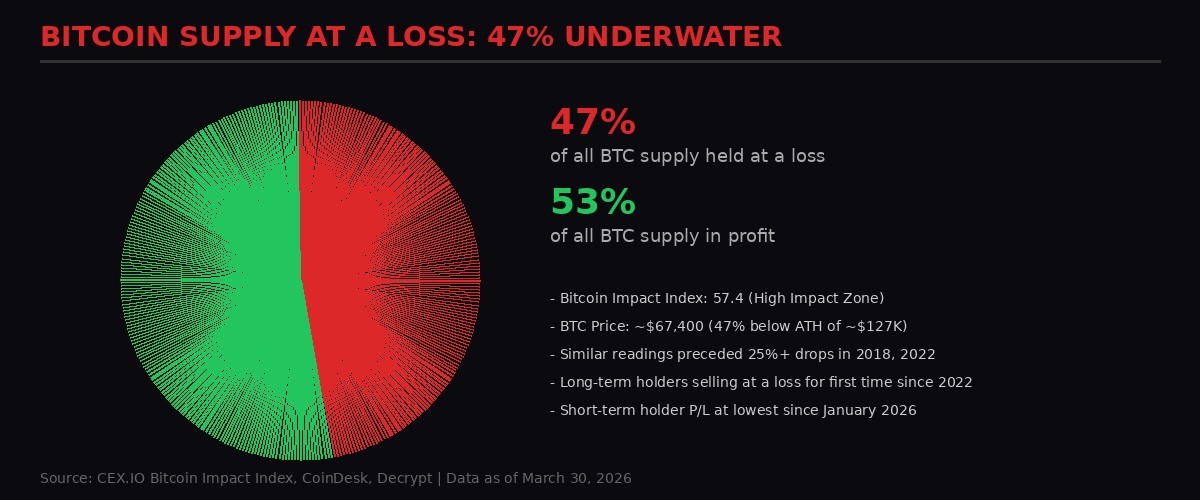
The numbers landed like a depth charge on March 30 when CEX.IO published its weekly Bitcoin Impact Index. The headline figure: 47% of all circulating Bitcoin - roughly 9.4 million BTC worth approximately $634 billion at current prices - is now sitting below its cost basis. That means almost half the people who own Bitcoin are losing money on paper.
The Bitcoin Impact Index itself surged to 57.4, firmly in what analysts call the "high impact" zone on a scale that tops out at 100. This is not a number that shows up in calm markets. CEX.IO's research team pointed to historical parallels that will make bull-market holdouts uncomfortable: similar readings appeared in late 2018 before Bitcoin fell from $6,000 to $3,200, and in mid-2022 before the slide from $30,000 to $15,500. Both times, the Impact Index spiking into the high-impact zone preceded drops of more than 25%.
The composition of the losses tells an even more troubling story. Long-term holders - the so-called "diamond hands" who have held their Bitcoin for more than 155 days - are now selling at a loss for the first time since the depths of the 2022 bear market. This is the group that historically defines market bottoms, because they are the last to capitulate. When long-term holders start realizing losses, it typically signals either a final washout before reversal or the opening phase of a much deeper correction.
Short-term holder realized profit and loss metrics are even worse. According to Checkonchain data referenced in CoinDesk's report, short-term holder P/L has fallen to its lowest level since late January 2026, when the Iran war first cratered confidence across risk assets. These are the traders who bought in the last five months expecting a bounce that never came. They are bleeding.
Critically, the panic selling that typically accompanies these stress levels has not fully materialized. Large-scale BTC transfers to exchanges remain limited, which suggests holders are in pain but not yet in full liquidation mode. Whether that's resolve or paralysis is an open question. The exchange netflow data from CryptoQuant shows modest inflows of about 43,000 BTC over the past week - elevated, but nowhere near the 100,000+ BTC weekly flows that characterized the November 2022 capitulation around FTX's collapse.
Bitcoin sits at approximately $67,400 as of April 1, which places it roughly 47% below its all-time high of approximately $127,000 reached in late 2025. For an asset that was supposed to be in the sweet spot of its four-year cycle, that drawdown is historically anomalous. The Iran war, the oil shock, and the Strait of Hormuz closure created a macro environment that no previous crypto cycle had to navigate.
46 Days of Fear: The Longest Streak Since FTX Died
The Fear and Greed Index has been locked in extreme fear since mid-February. (BLACKWIRE/VOLT)
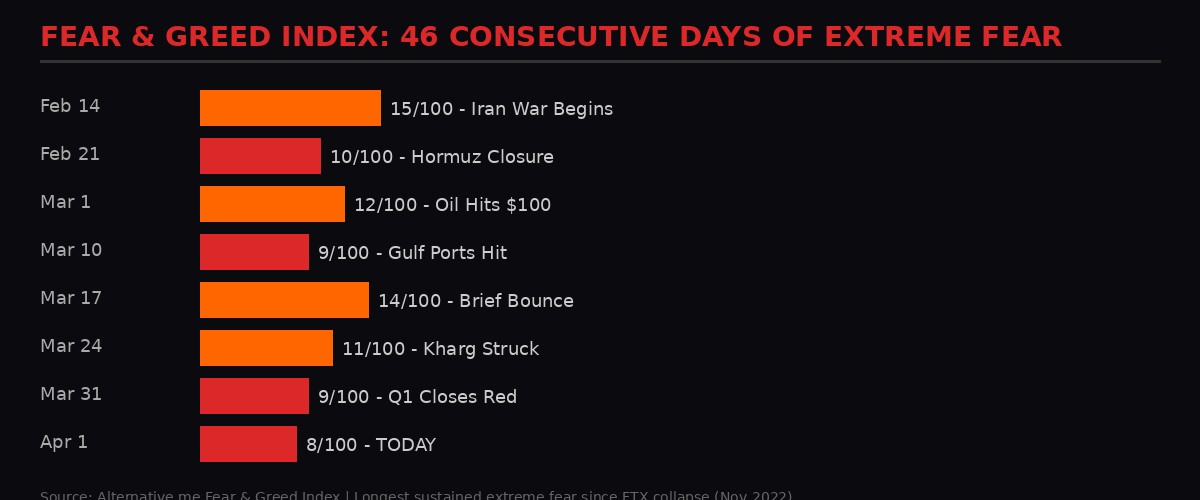
The Crypto Fear and Greed Index - the widely-tracked sentiment gauge maintained by Alternative.me - printed a reading of 8 on April 1, 2026. Eight. On a scale of zero to one hundred, where zero represents maximum terror and one hundred represents euphoric greed, the crypto market is essentially flatlining on fear.
This is not a one-day aberration. The index has now spent 46 consecutive days in "extreme fear" territory (below 25), with brief flickers up to 14 on March 17-18 providing the only relief. For context, the FTX collapse in November 2022 produced roughly 60 days of extreme fear. The current streak is already the second-longest in the index's history, and it shows no signs of breaking.
What makes the current reading of 8 particularly alarming is its persistence at single-digit levels. During the FTX meltdown, the index touched 6 once and bounced. During the Terra/LUNA collapse in May 2022, it hit 8 twice and bounced. In 2026, it has been below 12 for three straight weeks. The market isn't spiking into fear on a shock event and recovering. It's settling into fear as a permanent state.
The composition of the Fear and Greed Index draws from five weighted factors: volatility (25%), market momentum and volume (25%), social media sentiment (15%), Bitcoin dominance (10%), and Google Trends data (10%). All five components are currently flashing red. Volatility has compressed into a range that typically precedes explosive moves. Volume has declined steadily since the February panic. Social media sentiment across crypto Twitter and Reddit is at its most bearish in 18 months. Bitcoin dominance at 56% reflects capital hiding in the perceived safety of BTC over altcoins. And Google search interest in "buy Bitcoin" has fallen to levels not seen since late 2023.
The persistence of extreme fear is being driven by a convergence of macro and crypto-specific headwinds that would be unusual in any single quarter, let alone stacking simultaneously. The Iran-US war - now in its 33rd day - has kept oil above $100 for weeks, crushed Asian equity markets, and introduced genuine geopolitical uncertainty about the Strait of Hormuz through which 20% of the world's oil transits. Russia's gasoline export ban, effective today (April 1), adds fresh inflationary pressure just as markets were hoping for relief. And the specter of a Fed rate hike - discussed openly after the March FOMC - has reversed the rate-cut narrative that was supposed to fuel Bitcoin's 2026 rally.
The psychological dimension cannot be overstated. Crypto traders who entered the market in 2024-2025 expecting the four-year cycle to deliver a new all-time high above $150,000 are now staring at a 47% drawdown with no clear catalyst for reversal. That cohort represents roughly 30% of all current BTC holders, according to on-chain age distribution data. They have never experienced a true bear market. This is their education.
The Institutional Counter-Narrative: $18.7 Billion Says Buy

While retail panics, institutional desks are executing the largest accumulation campaign in Bitcoin's history. (Pexels)
Here is where the story splits in half and becomes genuinely confusing.
While retail sentiment is at generational lows, institutional capital has been flowing into Bitcoin at a pace that defies the fear narrative entirely. Spot Bitcoin ETFs recorded $18.7 billion in net inflows during Q1 2026, according to data compiled by SpotedCrypto and confirmed by Bloomberg ETF data. That pushes cumulative net inflows since the ETFs launched in January 2024 past the $65 billion mark.
Let those numbers sit for a moment. In a quarter where Bitcoin fell from $73,000 to $67,000, where the Fear and Greed Index spent nearly the entire period below 15, where a literal war erupted in the Middle East, institutional investors added $18.7 billion in net new capital to Bitcoin through regulated, US-listed exchange-traded funds. That is not cautious allocation. That is aggressive accumulation.
March alone saw $2.5 billion in inflows, according to OpenPR's Q1 analysis. This came even as equity ETFs were hemorrhaging capital - a dynamic that JPMorgan specifically flagged in a late-March note, observing that Bitcoin was holding ground while gold and silver ETFs faced significant outflows. The capital rotation from traditional safe havens into Bitcoin during a shooting war is a paradigm shift that the market has barely begun to price.
The divergence between retail sentiment and institutional flows has never been this wide. (BLACKWIRE/VOLT)
The whale accumulation data reinforces the ETF story. On-chain analytics show that wallets holding more than 1,000 BTC - the so-called "whale" tier - have added approximately 270,000 BTC at an average acquisition price of $67,800 over the past quarter. That's roughly $18.3 billion in whale-tier buying, almost perfectly mirroring the ETF inflow number. Whether these are the same entities buying through both channels or different pools of institutional capital arriving at the same conclusion is an analytical question. The directional signal is identical: big money is buying what retail is selling.
The most important institutional signal may have arrived on March 27, when Morgan Stanley filed with the SEC to launch its own spot Bitcoin ETF - ticker MSBT - with a fee of just 14 basis points. That's 11 basis points below the current category average and would make it the cheapest Bitcoin ETF in the market, undercutting even BlackRock's IBIT (which charges 25 basis points after its promotional period).
The fee war angle is interesting but secondary to the distribution angle. Morgan Stanley employs approximately 16,000 financial advisors who collectively manage $6.2 trillion in client assets. Bloomberg ETF analyst James Seyffart noted the fund could launch as early as this week. When it does, none of those 16,000 advisors would feel conflicted recommending a product at 14 basis points - it's cheap enough to be a no-brainer allocation for any diversified portfolio.
The significance is structural. Bitcoin ETF access to date has been driven primarily by self-directed investors and RIA (Registered Investment Advisor) channels. The wirehouses - Morgan Stanley, Merrill Lynch, UBS, Wells Fargo - have been the missing piece. Morgan Stanley's ETF filing cracks that door open. If even 1% of their $6.2 trillion advisory base allocates to Bitcoin, that's $62 billion in new demand - equivalent to the entire cumulative ETF inflow to date, arriving from a single distribution channel.
Bernstein's Call: Crypto Stocks Are 60% Off and It's Time to Buy
Bernstein cut targets across the board but maintained outperform ratings. The message: pain is priced in. (BLACKWIRE/VOLT)
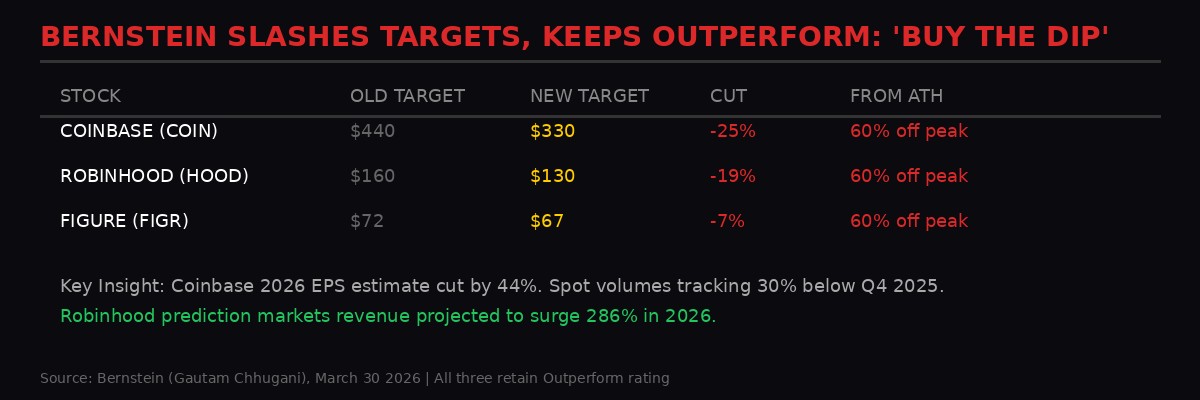
Bernstein - one of Wall Street's most respected equity research houses - dropped a note on March 30 that crystallized the institutional thesis. Analyst Gautam Chhugani cut price targets on all three major crypto-linked equities while maintaining Outperform ratings across the board. The message was unambiguous: we see the damage, we're pricing it in, and we're still telling you to buy.
The specifics: Coinbase (COIN) target cut from $440 to $330. Robinhood (HOOD) target cut from $160 to $130. Figure Technology Solutions (FIGR) target cut from $72 to $67. All three stocks are currently trading roughly 60% below their 2025 all-time highs.
The cuts were driven by near-term weakness that is undeniable. Coinbase spot trading volumes are tracking approximately 30% below Q4 2025 levels - a direct function of the fear-driven market. Bernstein slashed its 2026 earnings-per-share estimate for Coinbase by 44%, acknowledging that the revenue impact of lower volumes is significant and immediate.
But the Outperform rating tells the forward-looking story. Bernstein's thesis rests on three structural tailwinds: stablecoins, tokenization, and derivatives. Stablecoin transaction volume continues to grow regardless of Bitcoin's price action - a function of remittances, cross-border payments, and DeFi settlement that operates independently of speculative trading cycles. Tokenized real-world assets are approaching $25 billion in aggregate value, with Coinbase positioned as a custodian for major institutional tokenization platforms. And the CFTC's announced intention to bring perpetual futures onshore - a massive liquidity pool currently dominated by offshore exchanges like Binance and Bybit - could unlock a new revenue stream for regulated US platforms.
Robinhood's story within the Bernstein note was particularly interesting. While crypto trading revenue faces the same volume headwinds hitting Coinbase, Robinhood's prediction markets business is projected to surge 286% in 2026. That diversification cushion explains why the price target cut was proportionally smaller than Coinbase's. The prediction markets business is negatively correlated with crypto sentiment - when people are scared, they trade predictions. When people are euphoric, they trade crypto. Robinhood wins either way.
The 60% discount from peaks is historically meaningful. Bernstein's note explicitly drew parallels to previous crypto-equity drawdowns, noting that the last time Coinbase traded at this valuation multiple (around 15x forward earnings), it preceded a 200% rally over the following 12 months. Past performance guarantees nothing, but valuation compression to these levels in the face of structural growth is the textbook definition of a buying opportunity - if you believe the growth story survives.
The Macro Minefield: Oil, Russia, and the Fed's April Trap

Russia's gasoline export ban takes effect today. The energy shock isn't over - it's escalating. (Pexels)
The institutional buying thesis does not exist in a vacuum. It has to survive a macro environment that is actively hostile to risk assets, and the headwinds are intensifying as Q2 opens.
Russia's gasoline export ban took effect today, April 1, 2026. Deputy Prime Minister Alexander Novak instructed the energy ministry to draft the ban on March 27, and it was signed into law within 72 hours - a pace that signals genuine domestic supply concerns rather than geopolitical posturing. The ban will run through at least July 31, removing Russian gasoline from global markets during what is historically the peak demand season for refined petroleum products.
The timing compounds an already stressed energy market. The Iran-US war has kept Brent crude above $100 per barrel for weeks. The Strait of Hormuz remains effectively closed to commercial traffic. And the IEA's emergency reserve releases in mid-March failed to bring prices below the psychological $100 threshold - they briefly dipped to $98 before snapping back above $105. Russia pulling gasoline exports on top of this is like pouring accelerant on a fire that's already burning through the roof.
Energy analysts at DiscoveryAlert identified three scenarios for the combined impact. The most likely (greater than 60% probability): a swift spike in refined product prices that eases before summer as alternative supply routes adjust. The middle scenario (approximately 30% probability): sustained disruption through May with infrastructure constraints creating regional shortages, particularly in Central Asian and Eastern European markets dependent on Russian supply. The tail risk (under 5% probability): prices exceeding $130 per barrel with recession-level demand destruction that persists through summer.
For Bitcoin, the energy price equation cuts both ways. Higher energy costs increase mining operational expenses, squeezing already-thin margins for miners who represent forced sellers of BTC to cover electricity bills. Hash price - the revenue a miner earns per unit of hash power - has been declining since January. At $100+ oil, US-based miners running on grid power face margin compression of 15-25%, according to estimates from Marathon Digital's Q4 2025 earnings call. Some will capitulate and sell BTC reserves. That's supply hitting a market already struggling to absorb it.
On the demand side, higher energy prices feed inflation expectations, which feed higher interest rate expectations, which feed stronger dollar expectations, which feed weaker Bitcoin prices. It's a transmission mechanism that has been well-established in every cycle since 2020: the DXY (Dollar Index) and Bitcoin are inversely correlated approximately 70% of the time. If oil stays above $110 and the Fed responds with hawkish language at the April FOMC, the dollar strengthens and Bitcoin faces gravity.
The April FOMC meeting carries additional significance because it could be Fed Chair Jerome Powell's last meeting at the helm. His term expires in early 2026, and while the succession question has been quiet amid the Iran crisis, markets are acutely aware that any leadership transition introduces uncertainty. A hawkish final statement from Powell - or conversely, a dovish pivot to support an economy bleeding from energy costs - would both move Bitcoin, but in opposite directions. The market has priced in roughly 25% odds of a rate hike, according to CME FedWatch. If Powell surprises either direction, the move will be violent.
The Token Flood: $100 Million in Unlocks Hit a Fragile Market
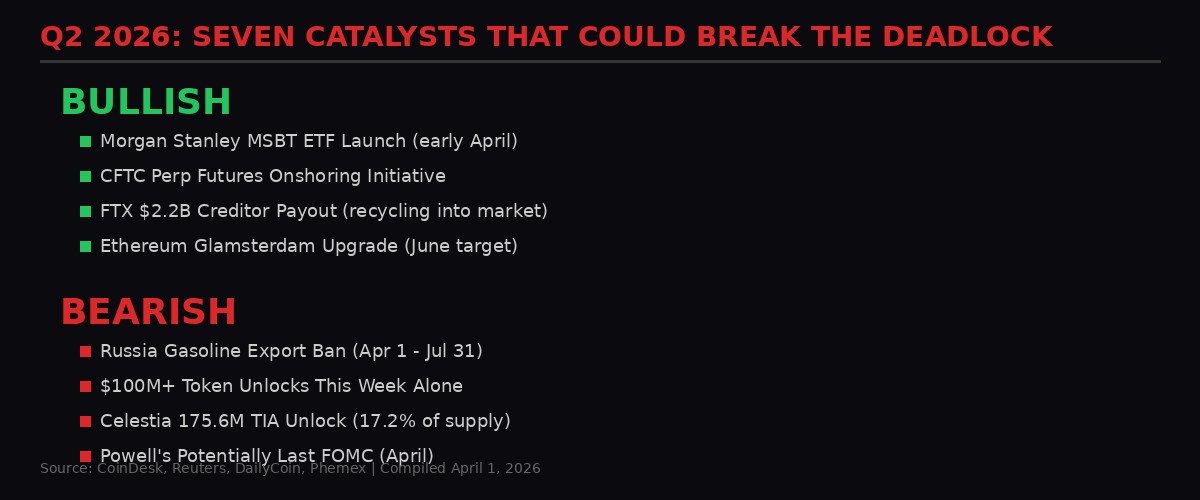
Q2 opens with bullish and bearish catalysts stacked simultaneously. (BLACKWIRE/VOLT)
If the macro picture isn't enough to worry about, the supply side of the crypto market is delivering its own stress test this week.
More than $100 million in token unlocks are scheduled between March 30 and April 5 across ten major projects. The largest: Sui, which unlocks $47.5 million in tokens on April 1 (today). EDGE follows with $16.6 million on April 2. These aren't small-cap vanity tokens. These are top-100 projects releasing meaningful percentages of their supply into a market that can barely absorb existing sell pressure.
The biggest unlock of the month is still ahead. Celestia (TIA) is scheduled to release approximately 175.6 million tokens on April 1 - a staggering 17.2% of total supply in a single release event. For perspective, when Arbitrum unlocked 13% of supply in March 2024, the token dropped 25% in two weeks. Celestia's unlock is proportionally larger and arrives into a market with significantly worse sentiment.
Pi Network adds its own supply pressure with roughly 200 million tokens unlocking throughout April, continuing a daily drip that has contributed to a 70%+ decline from its all-time high. Unlike Hyperliquid, which uses fees to buy back and burn tokens as a counter-pressure mechanism, Pi Network has no buyback program. The tokens unlock into the market and stay there, diluting existing holders with no offsetting demand.
The token unlock calendar creates a paradox for the institutional accumulation thesis. ETF buyers are adding Bitcoin. But the broader crypto market is simultaneously absorbing billions in newly unlocked supply across altcoins. Capital doesn't exist in isolation - every dollar that absorbs TIA or SUI unlock pressure is a dollar that isn't rotating into Bitcoin or Ethereum. The aggregate effect is a market that can't catch a bid even when institutional buyers are active, because new supply keeps overwhelming the demand.
DailyCoin's analysis of high-impact April unlocks identified several additional events worth monitoring: Aptos unlocks approximately 11 million APT tokens on April 12 ($82 million at current prices), Starknet releases its second major tranche on April 15, and Optimism continues its graduated vesting schedule throughout the month. The cumulative April unlock figure across tracked projects exceeds $1.5 billion - nearly 10% of the monthly ETF inflow pace.
The FTX Wildcard: $2.2 Billion Returns to Crypto-Native Hands

FTX creditors are getting their money back - right when Bitcoin is at its cheapest price of 2026. (Pexels)
One catalyst that could tip the balance landed yesterday: FTX began distributing $2.2 billion to creditors on March 31, 2026.
The distribution represents the second major payout from the FTX estate, bringing cumulative recovery for Dotcom customer claims to 96% and US customer entitlement claims to 100%. The people who lost everything when Sam Bankman-Fried's empire collapsed in November 2022 are now getting made whole - at 2022 prices. Since Bitcoin has roughly tripled from its FTX-era lows, creditors are receiving cash payments worth a fraction of what their crypto would be worth at current market prices. But they're receiving cash, and the question is what they do with it.
The bull case writes itself: FTX creditors were crypto-native investors before they were victims. They understood and believed in digital assets enough to deposit money on a crypto exchange. Now they're receiving $2.2 billion in liquid cash at a moment when Bitcoin is sitting near 2026 lows with a Fear and Greed Index at 8. The historical pattern from the first FTX distribution in early 2026 (which returned approximately $1.5 billion) suggests that roughly 40-50% of distributed funds are recycled back into crypto markets within 90 days, according to on-chain tracking of distribution wallet addresses.
If that pattern holds, approximately $900 million to $1.1 billion in FTX distribution money could flow back into crypto over the coming quarter. That's meaningful marginal demand hitting a market that's already seeing institutional accumulation. The timing - distributions arriving when prices are near annual lows - creates a naturally favorable entry point for creditors who are redeploying rather than exiting.
The bear case is simpler: some creditors will take the money and run. After three and a half years of waiting, after watching a bankruptcy process grind through courts while a war reshapes global markets, the psychological pull to just take the cash and never think about crypto again is real. Some portion of the $2.2 billion disappears from the crypto ecosystem permanently. The question is the ratio, and no one knows the answer yet.
The CFTC Wildcard: Perpetual Futures Come Home

The CFTC wants to bring perpetual futures onshore. The liquidity implications are massive. (Pexels)
Buried beneath the fear and the war noise, a structural regulatory shift is taking shape that could reshape crypto market plumbing over the next 12 months.
CFTC Chairman Michael Selig stated in late March that "bringing true crypto perpetual futures back to the United States is a key task of pro-innovation policy." This is not a casual remark. Perpetual futures - derivatives contracts with no expiry date - are the single most traded instrument in crypto, accounting for roughly 75% of all Bitcoin trading volume globally. Currently, essentially all of that volume flows through offshore platforms: Binance, Bybit, OKX, and Bitget. US retail investors are technically prohibited from accessing these platforms, which hasn't stopped millions of them from using VPNs to trade there anyway.
The CFTC's stated intention to bring perps onshore represents a potential $2-3 trillion annual notional volume opportunity for US-regulated exchanges. Coinbase, which already operates a derivatives platform (through its acquisition of FairX), and Robinhood, which has been quietly building derivatives infrastructure, would be primary beneficiaries. This is the structural growth tailwind that Bernstein's Outperform rating is partially built on - a regulatory greenfield that could multiply the addressable market for US crypto platforms by 5-10x.
The timeline is unclear. CFTC rulemaking typically takes 12-24 months from policy statement to implementation. But the Morgan Lewis memo published on March 30 detailed new CFTC FAQs that already clarify the use of "payment stablecoin, bitcoin, and ether" as acceptable margin collateral for derivatives positions. The regulatory infrastructure is being built incrementally, and the direction is unmistakable.
For the immediate Bitcoin price thesis, onshore perps matter because they would bring transparency and regulatory oversight to the derivatives market that currently operates as a black box. Offshore perpetual futures markets have been the source of multiple manipulation events, cascading liquidations, and opaque funding rate dynamics that amplify volatility. Bringing that volume onshore, under CFTC surveillance, could paradoxically reduce the extreme volatility events that generate fear - which would eventually improve sentiment metrics like the Fear and Greed Index.
The counterargument is that onshore perps could also increase leverage in the system. The reason offshore platforms are popular isn't just their permissionless access - it's the 100x leverage they offer. Regulated US platforms would likely cap leverage at 5-10x (consistent with existing CFTC margin rules for commodity futures). Lower leverage means lower risk, but it also means lower returns, which might not attract the same volume. The equilibrium between regulated safety and offshore wild west will take years to establish.
The Ethereum Angle: Glamsterdam Upgrade and the Defi Pulse

Ethereum's biggest upgrade since the Merge targets a June launch. ETH is 60% below its cycle high. (Pexels)
Ethereum deserves its own section in this analysis because its position is arguably even more precarious - and potentially more explosive - than Bitcoin's.
ETH is trading near $2,070 as of March 30, down approximately 60% from its cycle high. That's a deeper drawdown than Bitcoin's 47% and reflects the additional headwinds facing a platform where gas fees, DeFi total value locked, and network activity have all declined in Q1. Ethereum's revenue - measured by fees burned under EIP-1559 - has dropped to levels not seen since early 2024, before the ETF-driven rally.
But the Glamsterdam upgrade, targeted for June 2026, represents Ethereum's most significant technical overhaul since the Merge in September 2022. The upgrade would increase the gas limit from 60 million to 200 million per block and scale throughput to approximately 10,000 transactions per second - a 10x improvement over current capacity. Historical data compiled by Phemex shows that ETH tends to rally 20-40% in the six to eight weeks before major network upgrades, as speculators front-run the narrative.
If that pattern holds, a pre-Glamsterdam rally starting in late April or May could provide the catalyst that breaks the 46-day fear streak. Ethereum price action frequently leads altcoin sentiment, and a convincing ETH move above $2,500 would likely drag the Fear and Greed Index out of extreme fear territory for the first time since February.
BlackRock's approval of a staked ETH ETF (ticker ETHB) adds another institutional demand vector. The product - approved in March and expected to launch in Q2 - would allow investors to earn staking yield (currently around 3.5% annually) through a regulated ETF wrapper. That's a fundamentally different proposition than a Bitcoin ETF, which offers pure price exposure. A staked ETH ETF offers yield in a zero-real-return environment, which is exactly what income-focused institutional allocators are looking for.
Reading the Signals: Where This Resolves

The data points in opposite directions. The resolution will be binary and violent. (Pexels)
The divergence between retail sentiment and institutional positioning is not sustainable. One side will be proven right, and the correction will be sharp in either direction.
The bull resolution: $66,000-67,000 holds as the floor. FTX distribution money recycles into the market. Morgan Stanley's ETF launches and drives a new wave of advisory-channel inflows. The Iran war concludes (Trump has now set a three-week target for resolution). Oil drops below $90. The Fear and Greed Index rips from 8 to 40+ in the space of two weeks as short positions covering 52% above their average get squeezed. Bitcoin retests $75,000 by May. The 47% of supply currently underwater becomes 35%, then 25%. The cycle resumes.
The bear resolution: $66,000 breaks. Token unlocks overwhelm marginal demand. Russia's gasoline ban pushes oil above $120. The Fed hikes in April. Long-term holder capitulation that has started as a trickle becomes a flood. ETF inflows stall as risk-off goes global. Bitcoin visits $55,000-60,000, where roughly 70% of supply would be underwater. The Impact Index goes from 57 to 75+, entering zones that historically precede multi-month bear markets. The cycle is broken.
The probability-weighted view from JPMorgan's late-March analysis: readings in the current extreme fear range mark local bottoms 78% of the time. That historical batting average favors the bull resolution. But the two exceptions to that pattern - June 2022 and November 2008 - were both associated with systemic events (Terra collapse and Lehman Brothers, respectively) that had no parallel in prior history. An active shooting war in the Middle East with oil above $100 qualifies as exactly that kind of unprecedented systemic stress.
The honest answer is that nobody knows. The data is legitimately contradictory. What we can say with confidence: the resolution will be binary, it will be violent, and it will happen within the next 30-60 days. Markets this compressed don't stay compressed. The spring is loaded. The direction of the snap is the $634 billion question.
Get BLACKWIRE reports first.
Breaking news, investigations, and analysis - straight to your phone.
Join @blackwirenews on Telegram