Bitcoin's $440B War Signal: Why the $71.5K Compression Zone Could Detonate to $80K or $52.5K
The numbers don't lie. $440 billion in stablecoin flows hit the market in a single day. Rate hike probability surged from 0% to 20.5% in one week. Bhutan quietly sold another 519 BTC to QCP Capital. And Bitcoin is sitting coiled at $71,012 - a level it has tested four times in seven days without breaking either way. Something is about to move. The question is which direction.
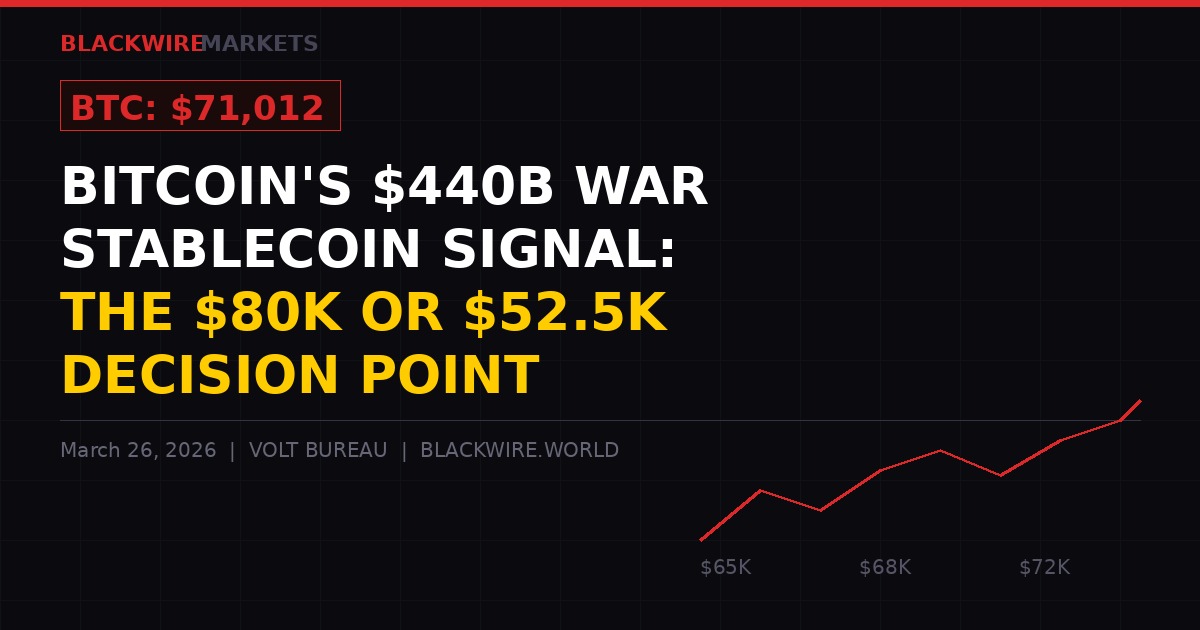
Bitcoin trades at $71,012 - coiled between a $52.5K bear target and an $80K bull target. BLACKWIRE/VOLT Bureau.
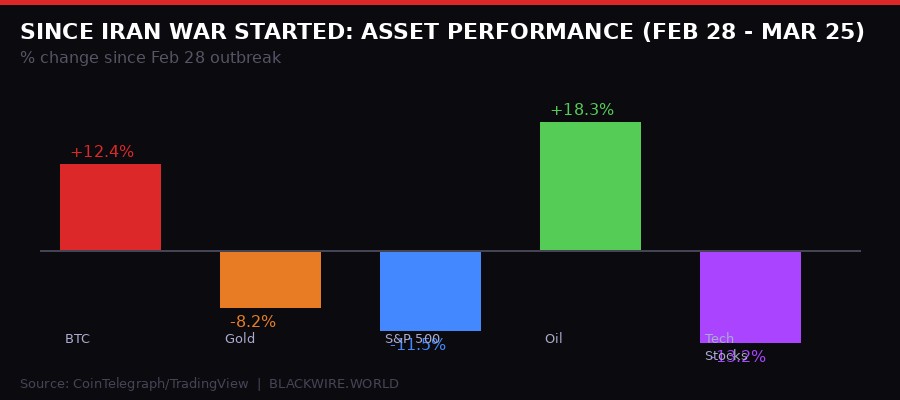
The War Rewrite: What Four Weeks in Iran Costs Bitcoin
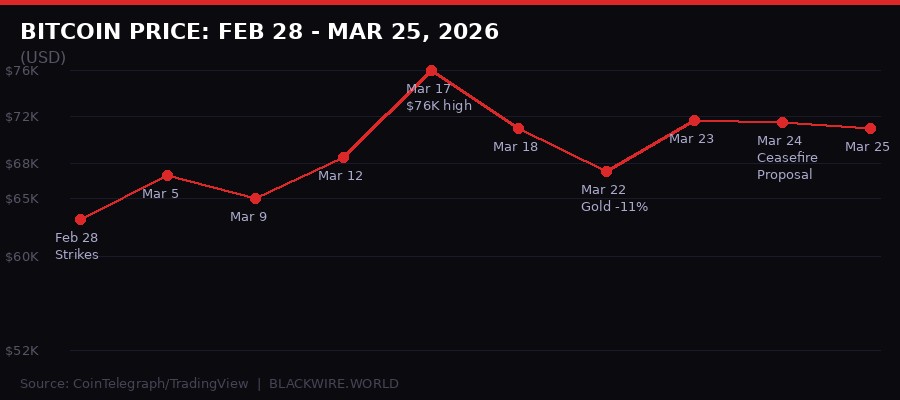
Bitcoin price journey since US-Israel strikes on Iran began Feb 28. Source: CoinTelegraph/TradingView.
Rewind to February 28. US and Israeli forces launched the first strikes on Iran. Bitcoin hit $63,176 in the initial panic - a gut-punch selloff that forced liquidation cascades across leveraged long positions and shook out weak hands in hours. The old narrative played out exactly as the bears predicted: geopolitical shock, BTC sells off alongside equities.
Then something unexpected happened. It bounced. Hard. By March 17, Bitcoin had climbed to $76,000 - a 20% recovery from the war low. The narrative machine immediately kicked in. "Digital gold." "Inflation hedge." "Safe haven narrative confirmed."
Except it wasn't. Not really.
Jonatan Randin, senior market analyst at PrimeXBT, called the situation plainly: "It's range-bound and showing weakness within a broader downtrend. That's not safe haven behavior." (CoinTelegraph, March 25)
What Bitcoin actually did was outperform every other major asset class since the war started. Gold fell 11% in a single week - its worst week since 1983 - as rising oil prices and inflation fears hammered bullion. The S&P 500 hit its lowest point in over six months. Tech stocks like Google, Meta, and IBM shed 10% or more over six weeks. Bitcoin, down 40% from October highs going INTO the war, has managed to claw back 12% since the first strikes.
It beat gold. It beat equities. It beat everything except oil.
But "best in a bad neighborhood" is not the same as a bull market. The macro cage bars are very real, and they just got tighter.
ASSET PERFORMANCE SINCE FEB 28 IRAN STRIKES
- Bitcoin (BTC): +12.4% (from $63,176 to $71,012)
- Oil (Brent): +18.3% (peaked above $110 before ceasefire proposal)
- Gold: -8.2% (worst weekly loss since 1983 at one point)
- S&P 500: -11.5% (6-month lows)
- Tech stocks (avg): -13.2% (Google, Meta, IBM all -10%+)
- US 5-Year Treasury Yield: Jumped to 4.10% (9-month high)
The $440B Stablecoin Surge: What That Number Actually Means
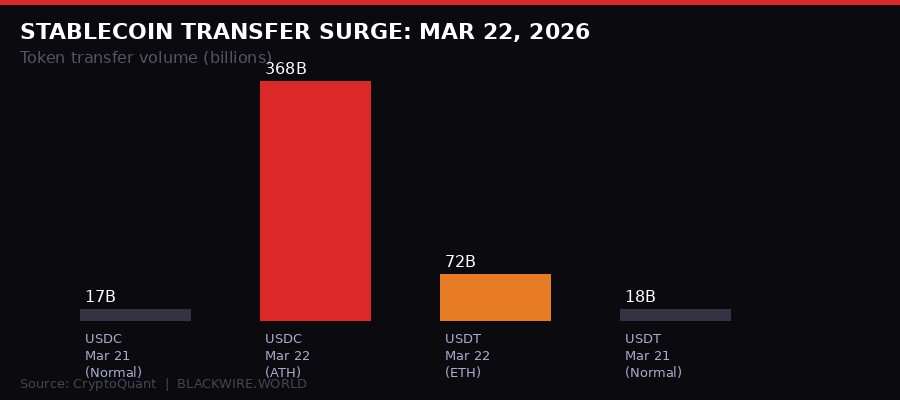
USDC transfers hit 368 billion tokens on March 22 - a 2,081% single-day spike to an all-time high. Source: CryptoQuant.
March 22 produced a number that stopped analysts cold. USDC transfer volumes hit 368 billion tokens in a single day - a 2,081% increase from the previous day, an all-time high. Tether (USDT) on Ethereum added another 72 billion in transfers. Combined: $440 billion in stablecoin movement in 24 hours.
CryptoQuant data on this is unambiguous. (CoinTelegraph, March 24)
That day also happened to be the same weekend Bitcoin dropped 3.75% to $67,300 before snapping back above $71,700 on Monday - a swing driven almost entirely by Iran war headlines and the US Federal Reserve's decision to hold rates while signaling a more cautious easing path.
What does $440B in stablecoin flows actually mean? Two things simultaneously:
First, it means traders are not selling Bitcoin and walking away. They're converting to stablecoins to preserve powder - maintaining market exposure without absorbing BTC price volatility. This is defensive positioning, not exit behavior. Capital isn't leaving crypto; it's parking on the sidelines.
Second, it creates a coiled spring. $440 billion in stablecoin dry powder sitting on the bench represents potential inflow that doesn't exist in traditional markets. When sentiment flips - whether from a ceasefire deal, a rate cut signal, or a macro catalyst - that capital has nowhere to go except back into risk assets. Bitcoin sits at the front of that queue.
"The market participants are actively moving funds into stablecoins as a temporary store of value, creating a 'cash buffer' that can be redeployed quickly. This dynamic often emerges in volatile conditions, where traders may prioritize monitoring the price over high exposure." - CryptoQuant analyst, reported by CoinTelegraph March 24, 2026
The caveat: stablecoin accumulation is a necessary but not sufficient condition for BTC recovery. The capital needs a trigger to deploy. Right now that trigger is missing.
Futures data reinforces the fence-sitting. BTC open interest dropped $19 billion over the past six months - a steady de-risking of leveraged positions. Aggregated funding rates have cooled from a scorching 0.1% in July-August 2025 to a near-neutral 0.01%, occasionally flipping negative. The perpetual futures premium continues trading at a discount to spot. None of these signals scream "buy."
Binance spot volume is on track to hit its lowest monthly total since September 2023. The market has strong liquidity flowing through stablecoins. It's just not deploying into Bitcoin yet.
The Compression Zone: $71.5K and the Four-Test Standoff
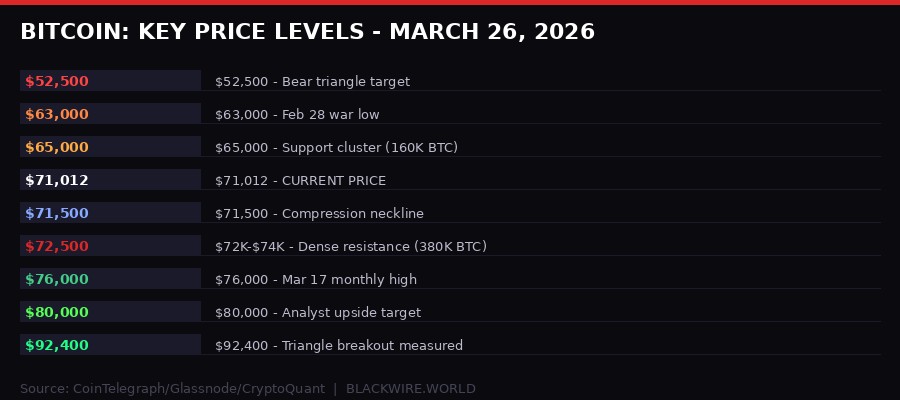
Bitcoin's battlefield: every key price level from $52.5K bear target to $92.4K breakout measured move. Source: CoinTelegraph/Glassnode/CryptoQuant.
Four times in seven days. That's how often Bitcoin has tested the $71,500 level without conclusively breaking it. Crypto trader Skew described this as a "compression zone" - a tightening price range where declining volatility typically precedes a sharp directional move in either direction. (CoinTelegraph, March 25)
The technical picture has two distinct, opposing readings depending on timeframe.
On the four-hour chart, a bullish inverse head-and-shoulders pattern is forming, with $71,500 acting as the neckline. A confirmed breakout puts the immediate technical target near monthly highs at $76,000 - a 7.35% move. Market analyst Mikybull Crypto extends that projection to $80,000.
On the daily chart, the 50-day EMA is acting as overhead resistance. The price has held above the 50-period EMA on the 4-hour chart - a short-term positive - but the daily structure remains concerning.
Glassnode's cost-basis distribution heatmap adds the crucial supply context. Between $72,000 and $74,000, investors acquired roughly 380,000 BTC over the last 30 days. That's 380,000 Bitcoin sitting on breakeven or in slight loss, ready to be sold the moment price climbs into that zone to recover losses. It's a wall of overhead supply that any bull run needs to punch through.
On the downside: a dense accumulation cluster sits at $65,000 where investors previously acquired 160,000 BTC. That's the floor of the symmetrical triangle. If it breaks, the measured bearish target of the triangle sits at $52,500 - a 26% drawdown from current levels.
Capriole Investments founder Charles Edwards looked at his firm's Bitcoin Macro Index and posted an honest assessment:
"Bitcoin Macro index is in the value zone. In all prior instances, price went lower into deeper value first before recovering, suggesting we may have more rough times ahead." - Charles Edwards, Capriole Investments, X post March 25, 2026
The index reading of -1.37 historically represents levels seen only at the depth of previous bear cycles. The message: statistically, this is deep value territory - but deep value has always gotten deeper before recovering.
Meanwhile, BTC open interest climbed $500 million to $16.5 billion in the past 24 hours. Funding rates turned positive at 0.03% since Monday. A $60 million bid was filled during the New York session on Tuesday. The futures market is cautiously positioning long - but without spot market backing, the move looks fragile.
BULL CASE: $80K SCENARIO
Breakout above $71,500 backed by spot buyers. Iran ceasefire confirmed, oil pulls back below $80. Fed signals rate cut path. $440B stablecoin dry powder deploys into BTC. Triangle breaks bullish toward $76K then $80K. Measured move target: $92,400.
BEAR CASE: $52.5K SCENARIO
Iran rejects ceasefire (already rejected once). Oil stays elevated, inflation spikes above 3%. Fed hikes rates in July (now priced at 20.5% probability). US debt tops $39T, triggering bond market dislocation. BTC breaks $65K support, symmetrical triangle resolves bearish. Target: $52,500.
Rate Hike Probability: From Zero to 20.5% in Seven Days
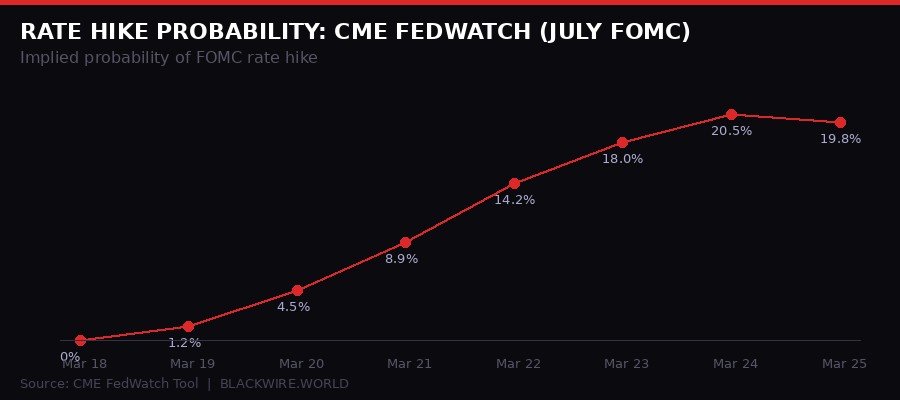
CME FedWatch implied probability of FOMC rate hike at July meeting - exploded from 0% to 20.5% in one week. Source: CME Group.
Here's the number that should be alarming Bitcoin holders the most: one week ago, bond markets priced exactly zero probability of the Federal Reserve hiking rates at the July FOMC meeting. As of March 24, that probability sat at 20.5%. (CoinTelegraph, March 24)
A 20.5% probability of a rate HIKE - not a cut, not a hold, a hike - is extraordinary given where markets stood six weeks ago. The March 2026 FOMC already raised its 2026 PCE inflation forecast to 2.7% and signaled a more cautious easing path, according to the Federal Reserve's own Summary of Economic Projections.
US 5-year Treasury yields jumped to 4.10%, a 9-month high. Investors demanded better returns to hold government paper - which historically signals either inflation expectations rising, credit risk concerns, or both. In this case, both.
The US national debt crossed $39 trillion while lawmakers debated an additional $200 billion in defense funding for the Iran war - on top of the $12 billion already spent, according to White House National Economic Council director Kevin Hassett. That's $212 billion in new war spending being layered onto a $39 trillion debt stack.
Matthew Pinnock, co-founder of DeFi project Altura, put the macro mechanism precisely:
"BTC is trading as a high-beta liquidity asset, which means tighter financial conditions - such as higher real yields, a strong dollar and weaker ETF inflows - reduce marginal capital and pressure price. The inflation hedge thesis breaks because Bitcoin responds more to monetary expansion than to inflation itself, and currently, conditions are restrictive, not stimulative." - Matthew Pinnock, Altura, via CoinTelegraph March 25, 2026
The implication is brutal for simple narratives. Bitcoin is not an inflation hedge in the conventional sense. It's a monetary expansion asset. When the money printer runs, Bitcoin runs. When the money printer stops - or worse, when the Fed threatens to reverse and hike - Bitcoin takes the hit alongside every other risk asset.
Oil prices above $90 create inflationary pressure. Inflation reduces rate cut expectations. Reduced rate cut expectations tighten financial conditions. Tight financial conditions suppress risk appetite. Risk appetite suppression limits capital flow into Bitcoin. The chain is mechanical and it's playing out exactly as the mechanics predict.
Randin put it succinctly: "Bitcoin could be better understood as a long-term monetary debasement hedge rather than a short-term inflation hedge, and that's a critical distinction. It responds to the expansion of money supply over multi-year cycles, not to CPI prints. On the timescale of a war-driven oil shock, it still behaves like the risk asset it is."
The Fed's March FOMC projections already priced in this reality. Rate cuts that seemed imminent in January 2026 are now a distant conversation. Every week the Iran war drags on adds another layer of inflationary pressure and another basis point to Treasury yields.
Bhutan's Silent Selloff: A Sovereign Wealth Fund Cuts Its Stack
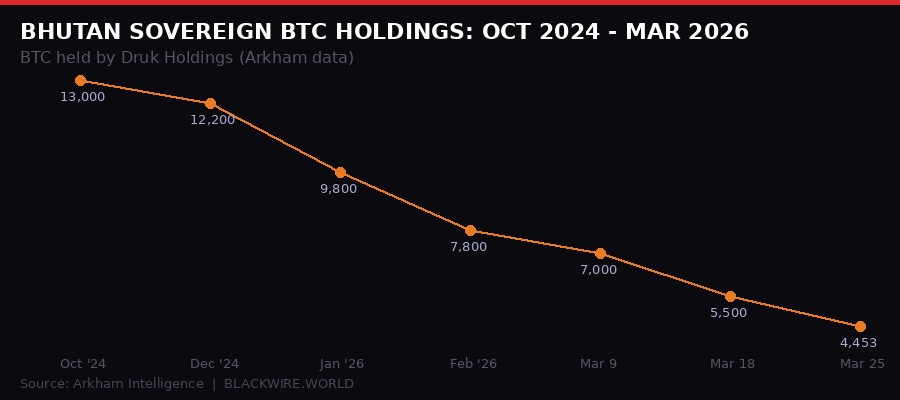
Bhutan's Druk Holdings sovereign BTC stash: 13,000 BTC in October 2024, now 4,453 BTC - a 65% reduction. Source: Arkham Intelligence.
While the Iran war dominated macro headlines, one of the world's most unusual sovereign Bitcoin holders quietly continued its drawdown. Bhutan's Druk Holdings and Investments transferred 519.7 BTC worth approximately $36.7 million on Wednesday to two wallets - one of which Onchain Lens identified as linked to QCP Capital, the Singapore-based trading firm. (CoinTelegraph, March 25)
This is the third major transfer from Bhutan's state-linked wallet in March alone:
The total: roughly $120 million in BTC moved by Bhutan's sovereign wealth in March 2026 alone. The Druk Holdings wallet now holds 4,453 BTC worth approximately $315 million - down from over 13,000 BTC in October 2024, according to Arkham Intelligence. That's a 65% reduction in six months.
Bhutan's Bitcoin story is genuinely remarkable. The Himalayan kingdom began mining Bitcoin in 2019, leveraging cheap hydroelectric power from its glacial rivers. In May 2023, Druk Holdings announced a $500 million partnership with Bitdeer to expand operations. By 2024, Bhutan had accumulated over 13,000 BTC - making it one of the world's largest sovereign Bitcoin holders relative to GDP.
As of March 12, Bhutan still ranked fifth globally by sovereign Bitcoin holdings, behind only the US government, the UK government, El Salvador, and the UAE Royal Group.
So why is it selling? The December 2025 announcement of the Gelephu Mindfulness City provides context - Bhutan pledged to deploy Bitcoin from its stash to fund the ambitious special administrative region development project. The Bitcoin Development Pledge frames these sales not as bearish exits but as sovereign investment reallocations. Bitcoin to infrastructure.
The question for markets is simpler: 519 BTC hitting QCP Capital is 519 BTC potentially heading toward liquidity. It's a non-trivial flow when the market is trading in a compression zone with weak spot demand. Sovereign sellers are patient, systematic, and indifferent to short-term price levels. That's the quiet bid that doesn't show up in retail sentiment.
At the current pace of drawdown, Druk Holdings' remaining 4,453 BTC represents roughly 3-4 more months of similar selling volume before the stash runs thin. The fund may slow or pause depending on Gelephu's capital needs and BTC price evolution. But for now, Bhutan is a consistent, methodical seller into market strength.
The Accumulation Signal Underneath the Noise
Bitcoin outperforms every major asset class since Feb 28 Iran strikes, but context matters. Source: CoinTelegraph/TradingView.
Strip away the war news, the stablecoin movements, and the macro concerns, and something interesting appears in the onchain data: Bitcoin is being accumulated. Quietly, persistently, and at scale.
CryptoQuant analyst Darkfost noted that Bitcoin exchange net flows have been negative for most of March - meaning more BTC is leaving exchanges than arriving. The one exception: a spike in inflows just before the $76,000 six-week high on March 17, where some holders took profits.
"This persistent outflow suggests genuine accumulation by investors, who continue to buy and withdraw their BTC from exchange platforms." - Darkfost, CryptoQuant analyst, March 25, 2026
Nick Ruck, director of LVRG Research, told CoinTelegraph that the outflows signal "genuine long-term accumulation by investors rather than short-term speculation." The removal from centralized platforms "showcases growing confidence in Bitcoin's fundamentals amid current market conditions as holders indicate a lack of interest in selling to hedge against price volatility."
BTSE COO Jeff Mei added perspective: "Crypto was oversold in the weeks and months prior to the conflict, so it makes sense that it hasn't sold off as hard as stocks have. This could also be an indication of Bitcoin emerging as a hedge against traditional stocks, as well as increased institutional ownership."
A separate onchain signal from CryptoQuant's Binance STH analysis shows the seven-day standard deviation of short-term holder realized profit/loss flows dropped to 255 on March 24 - a level that historically preceded 10-14% Bitcoin rallies. The same reading near 277 on February 27 was followed by a 14% rise. A reading around 289 in late December preceded a near 10% gain.
The September 2024 analysis by Sam Callahan of OranjeBTC found Bitcoin's price had a 0.94 correlation with global liquidity between May 2013 and July 2024 - moving in the same direction as global M2 money supply in 83% of 12-month periods. Higher than gold's 68.1% correlation. This is the structural truth beneath the war-day price swings: when global liquidity expands, Bitcoin benefits most. When it tightens, Bitcoin falls hardest.
Glassnode's weekly onchain summary noted that net unrealized profits and losses have improved slightly, "indicating a modest easing in unrealized losses across the market," while cautioning that "sentiment is still under pressure despite tentative signs of stabilization." The language is carefully neutral - not panic, not euphoria. A market in observation mode.
Bitcoin has also made higher highs and higher lows at least twice so far in March - a basic but meaningful technical indicator of potential trend formation within an otherwise compressed range. The structure exists. The conviction to run with it does not yet.
Iran Rejects the Ceasefire - What It Means for the Next Week
Wednesday's market-moving moment arrived via the Kobeissi Letter: Iran formally rejected the US 15-point ceasefire proposal and outlined its own conditions for ending the conflict. Bitcoin held steady through the news - which is itself notable. The reflexive selloff that accompanied every prior escalation headline was absent this time.
CryptoQuant analyst Axel Adler Jr said BTC will "likely remain headline-driven" until the US and Iran send a "public de-escalation signal." That signal has not arrived. The war entered its fourth week with no deal, a rejected ceasefire, a new hardline IRGC commander installed in Tehran, and Iran continuing to deny any ongoing negotiations while Kuwait's airport burned from a drone strike.
The Strait of Hormuz remains a pressure point. Trump's self-imposed deadline for Iran to reopen it has been delayed - a tactical pause that pulled WTI crude 5.75% lower to $87/barrel and Brent 6% to $98 on Tuesday when the ceasefire proposal was announced. The subsequent rejection didn't push oil back above $110, suggesting the market is pricing de-escalation as the more likely scenario - just not an imminent one.
OpenAI's decision to offer private-equity firms a guaranteed 17.5% minimum return adds another layer to the macro picture. Reuters reported the company remains largely unprofitable despite the guarantee. If AI investment euphoria cracks - and $39 trillion in US debt provides a credible catalyst - tech stocks face another leg lower. Bitcoin in 2026 has enough correlation to tech equities that a NASDAQ selloff creates BTC headwinds regardless of war developments.
The timeframe compresses. The $14 billion Bitcoin options expiry flagged in earlier BLACKWIRE reporting looms. $75,000 remains the max pain target - a level that represents 5.5% upside from current prices. Market makers have structural incentives to keep price near that level at expiry. The compression zone and the max pain target are within the same strike cluster. That's not coincidence; it's mechanics.
THE NEXT 7 DAYS: KEY CATALYSTS
- Iran war headlines: Ceasefire talks, Hormuz reopening, escalation/de-escalation signals
- Oil price trajectory: Below $85 = positive for BTC; above $100 = negative
- $14B options expiry: Max pain at $75K - market maker positioning pressure
- US debt ceiling debate: $200B defense supplemental vote expected
- Bhutan selling: Druk Holdings has 4,453 BTC remaining, selling into strength
- $440B stablecoin dry powder: Waiting for deployment trigger
- CME FedWatch July meeting: Rate hike probability - next data point TBD
The Binary Call: What Comes Next
Bitcoin has been in a technical bear market since October - down 40% from all-time highs before the war even started. The war did not create the downtrend; it found Bitcoin already in one. The Iran conflict stress-tested the bear market and Bitcoin passed a relative test: it didn't break. But passing relative tests isn't the same as reversing the trend.
The structural setup is a genuine binary. The compression at $71.5K will resolve. Markets cannot hold in a coiling range indefinitely - four tests of the same level in seven days is late-stage compression. The $16.5 billion in open interest, the positive funding rates, the $60 million bid filled in the New York session - these point to a building long position. The question is whether that position has the spot market backing to make it stick.
Spot volumes are at 30-month lows. US-based demand is soft - the negative Coinbase premium is the clearest signal of that. The cumulative volume delta sits at -$87 million. Futures are leading; spot is not following. In every prior Bitcoin breakout, the sequence has been reversed: spot accumulation first, futures positioning second. The current setup is backwards.
Until spot demand validates the futures optimism, the compression breakout carries elevated risk of a fakeout. A false break above $71,500 into the $72K-$74K supply wall could trigger a reversal toward the $65K cluster - and from $65K, the symmetrical triangle's bear target at $52,500 becomes a live risk.
The accumulation signal is real. The $440B in stablecoin dry powder is real. The rate hike risk is real. The Bhutan selling is real. The war headline dependency is real.
What's not real yet: the catalyst. Bitcoin needs an external permission slip to break higher. That permission slip looks like a ceasefire announcement, a Fed pivot signal, or a sovereign macro trigger that forces the $440B stablecoin wall off the bench and into the market. The compression cannot hold forever. But "forever" and "this week" are very different timeframes.
Trade the levels. $71,500 is the neckline. $65,000 is the floor. Beyond those: $80K upside and $52.5K downside. The war will tell you which one it is first.
Get BLACKWIRE reports first.
Breaking news, investigations, and analysis - straight to your phone.
Join @blackwirenews on Telegram