
Eight days of cautious rebuilding. One tweet from the president. Gone. (Unsplash)
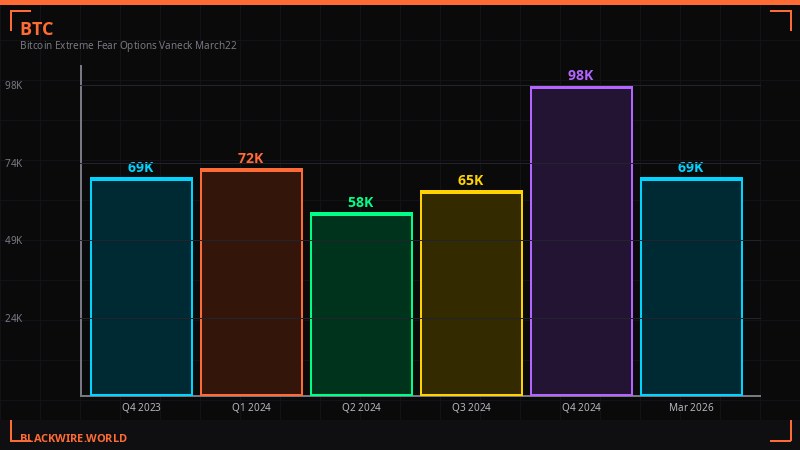
Bitcoin hit $75,912 last Tuesday. It was trading at $69,192 Sunday morning. That 9% round-trip took exactly seven days to build and fewer than 24 hours to destroy.
The mechanism was simple and brutal. Markets had spent the prior week pricing in a ceasefire. Then, late Saturday night U.S. time, President Donald Trump posted a message threatening to "hit and obliterate" Iran's power plants - beginning with the largest - if the Strait of Hormuz wasn't reopened to commercial shipping within 48 hours. The market, positioned heavily bullish after eight green days, had exactly no preparation for it.
CoinGlass data shows $299 million in total liquidations over 24 hours across 84,239 traders. Long positions accounted for $254 million of that - 85% of the total damage. The single largest liquidation was a $10 million BTC-USDT position on OKX. When 85% of the liquidations are longs, the market was only capable of going one direction on a shock headline: straight down.
The 48-hour window closes Monday evening U.S. time. There is no indication Iran intends to comply.
$254M in long liquidations. The market leaned bullish into the weekend and paid the price. (Source: CoinGlass / BLACKWIRE)
Markets Snapshot - March 22, 2026 08:30 CET
The Ultimatum That Reversed a Week of Gains

From de-escalation to obliteration threats in 24 hours. Markets had no framework for the whipsaw. (Unsplash)
Friday's narrative was one of tentative optimism. Trump had suggested he was "thinking about winding down" the military operation against Iran. Risk assets breathed. Bitcoin had built a steady staircase from its lows, gaining nearly $10,000 from the panic bottom as traders bet on a negotiated off-ramp.
That changed Saturday. Trump reversed position entirely, issuing a 48-hour ultimatum: reopen the Strait of Hormuz or face direct strikes on Iranian power plants. The specific mention of civilian energy infrastructure - a threshold that most military analysts regard as a serious escalation - was new. Previous strikes had targeted naval assets and missile facilities. Power plants serving civilian populations is a different category.
The Strait of Hormuz remains effectively closed to most commercial traffic. Roughly 20% of the world's oil and gas flows pass through it daily. The disruption has pushed oil above $100 per barrel, a level that feeds directly into energy-intensive industries worldwide - including, critically, bitcoin mining operations.
Going from "winding down" to "obliterate civilian infrastructure" in 24 hours exposed just how mechanically reactive crypto markets have become to geopolitical signals. The Friday positioning reflects what traders believed. The Saturday liquidation reflects what actually happened. The spread between those two things was $299 million.
"Bitcoin has once again acted as the canary in the macro coal mine. At current levels, bitcoin is already pricing a recession, while many traditional assets are not." - Andre Dragosch, European Head of Research, Bitwise
The lopsided liquidation ratio - 85% longs - tells the positioning story clearly. For eight consecutive days, traders had been buying the dip, adding leverage on the assumption that de-escalation was coming. Weekend headlines killed that assumption in the early hours of Sunday, when thin liquidity amplified every move.
Miners in the Red: $19,000 Loss Per Coin

Production cost: $88,000. Market price: $69,192. Every block mined is now a guaranteed loss. (Unsplash)
The Iran war didn't just hit prices. It hit the industry that maintains the entire Bitcoin network.
Checkonchain's difficulty regression model - which estimates average production costs based on network difficulty and energy inputs - pegged the average cost at $88,000 per bitcoin as of mid-March. With BTC trading at $69,192 on Sunday, the average miner is now operating at a loss of roughly $18,800 per coin - a 21% deficit on every block produced.
Oil above $100 per barrel is a direct input cost problem for mining operations. Electricity prices for data centers and mining farms track energy commodity prices with roughly a one-to-two month lag, depending on power contracts. The estimated 8-10% of global hashrate operating in energy markets sensitive to Middle Eastern supply - including parts of Central Asia and certain Gulf state operations - are facing acute cost pressure right now.
The network is already showing the stress in its core metrics:
$88,000 production cost vs $69,192 market price. Every miner running is running at a loss. The hashrate tells the rest of the story. (Source: Checkonchain / Luxor / BLACKWIRE)
Bitcoin Mining Network Stress Metrics
The difficulty adjustment on Saturday - down 7.76% to 133.79 trillion - was the second-largest negative adjustment of 2026. The largest was February's 11.16% drop during Winter Storm Fern. Difficulty is now nearly 10% below where it started the year, and far below November 2025's all-time high near 155 trillion.
Hashprice - the metric tracking expected miner revenue per unit of computing power - is hovering at $33.30 per petahash per second per day, according to Luxor's Hashrate Index. That number is near breakeven for efficient modern hardware and not far from the all-time low of $28 hit on February 23. Older generation machines are already pure cash furnaces.
When miners can't cover costs, they sell bitcoin to fund operations. That creates a structural supply overhang that market bulls have to absorb. The timing is terrible: 43% of total bitcoin supply is already sitting at an unrealized loss, and whale wallets have been distributing into every relief rally since October's $126,000 all-time high. Miner selling is a third layer of pressure on top of that.
The publicly traded mining companies have been pivoting to survive. Marathon Digital, Cipher Mining, and others have been building out AI inference and high-performance computing capacity alongside their mining operations, seeking more predictable revenue streams than mining at a guaranteed loss. That pivot accelerated significantly in Q1 2026 as the math became undeniable.
The next difficulty adjustment is projected for early April and is expected to decline further based on current CoinWarz data. If bitcoin stays below $88,000, and there is no near-term catalyst for a return to those levels, the miner exodus continues. Difficulty keeps falling. The network self-corrects. But the damage to spot markets from forced miner selling happens in the gap between when costs exceed revenue and when difficulty adjusts low enough to restore profitability.
Options Markets Pricing in Extreme Fear - and What That Historically Means

Put premiums hitting all-time highs in relative terms. The options market is telling a specific story. (Unsplash)
VanEck's mid-March 2026 Bitcoin ChainCheck report, published Friday, documented what the options market has been screaming for weeks: institutional traders are paying record prices for downside protection, even as spot prices stabilize.
The numbers are stark. Traders spent $685 million on put options over the 30-day period analyzed. Call premiums fell 12% to $562 million over the same period. The put/call open interest ratio averaged 0.77 and peaked at 0.84 - the highest since June 2021, when China's mining ban triggered the last major miner capitulation event.
Relative to spot volume, put premiums reached roughly 4 basis points - an all-time high in VanEck's dataset. For context, that is approximately 3x the levels seen in mid-2022 following the Terra/Luna collapse and the Ethereum staking liquidity crisis.

$685M in put spending vs $562M in calls. The put premium relative to spot volume just hit an all-time high. (Source: VanEck Bitcoin ChainCheck / BLACKWIRE)
The put/call ratio is often read as a pure fear indicator - and in this case it clearly reflects genuine defensiveness. But VanEck's analysts offered a contrarian read that's worth tracking. In the past six years, similar options skew readings - where put premiums spike to extreme relative highs - were followed by average bitcoin gains of 13% over the next 90 days and 133% over the following 360 days.
The logic: extreme fear readings mark capitulation zones, not fresh breakdown zones. When everyone who is going to sell has sold, when everyone who is going to buy insurance has bought it, the cost of being wrong about downside diminishes. The market becomes asymmetrically positioned for recovery.
That historical pattern doesn't mean the bottom is in. It means the conditions that have historically preceded bottoms are present. Futures funding rates also eased to 2.7% from 4.1%, suggesting leveraged speculation has cooled substantially - another marker that often appears near local lows.
"Relative to spot volume, put premiums reached an all-time high of roughly 4 basis points, roughly 3x the levels seen in mid-2022 following the Terra/Luna stablecoin collapse and the Ethereum staking liquidity crisis." - VanEck Mid-March 2026 Bitcoin ChainCheck Report
The caveat that VanEck's historical patterns didn't include is an active war with potential strikes on civilian energy infrastructure arriving Monday. A 48-hour ultimatum that produces actual strikes rather than a negotiated outcome would be a new input with no direct historical analogue in crypto markets. That uncertainty is precisely why traders are paying record prices for downside protection right now.
The Macro Environment: Rate Hike Bets, Bond Selloff, Gold Collapse
The rate debate has flipped 180 degrees in two weeks. The bond market is reflecting the new reality. (Unsplash)
The crypto markets don't exist in isolation. The macro environment that bitcoin is navigating right now would be difficult even without the Iran war.
Six weeks ago, the U.S. rate debate centered on how many Fed cuts were coming in 2026. That conversation has completely reversed. According to CME FedWatch, the probability of the Fed raising rates at its April meeting has risen to 12% - up from 0% one week ago and a total reversal from two months ago, when a cut was the consensus expectation.
The inflation arithmetic behind that shift is straightforward. February data showed headline CPI at 2.4% and core at 2.5% annually - those numbers were collected before the Iran war and the subsequent 50% surge in oil prices. The March and April CPI readings will capture the full oil shock. The Fed held rates on Wednesday with a dovish lean, but the data coming into that decision is about to get significantly more complicated.

Rate hike odds at 12%, 10-year yields at 4.38%, gold down 17% from early March peak, S&P on four-week losing streak. (Source: CME FedWatch / Reuters / BLACKWIRE)
The bond market is already pricing in the new reality. The 10-year U.S. Treasury yield has climbed to 4.38%, up 10 basis points on Friday alone and up more than 38 basis points since early March when it was trading below 4%. That move in bond yields is significant: it raises the discount rate on risk assets, makes cash and fixed income more attractive relative to speculative positions, and signals that inflation expectations are drifting higher.
The bond selloff is global, not just an American phenomenon. UK 10-year gilt yields have jumped above 5%, up 15% in the past month and at their highest levels since 2008. European sovereign debt has been under pressure. When the risk-free rate is rising across every major currency simultaneously, capital has fewer places to hide at acceptable risk-adjusted returns.
Perhaps the most striking price signal has been gold. The precious metal, which ran to approximately $5,500 per ounce at the start of March on war-premium buying, has crashed to $4,569 - a 17% decline in three weeks. Silver has been even more brutal, collapsing from $95 to $69.50 per ounce. Traditional safe-haven assets are not behaving as safe havens.
The S&P 500 is down more than 5% since late February and on track for a fourth consecutive weekly loss. The Nasdaq has dropped similarly. Equity markets have so far avoided a panic crash, but the slow bleed of four straight losing weeks is eroding the risk appetite that typically supports crypto valuations.
Against that backdrop, bitcoin's performance looks almost resilient. Up modestly since the start of March, it has outperformed gold, silver, and equities since the war began. Whether that reflects genuine store-of-value adoption or simply that crypto has already priced in the recession risk that traditional assets haven't fully absorbed yet is the central debate among market analysts right now.
Strategy Keeps Buying: 761,068 BTC and Counting

Strategy has been the market's largest single buyer through the entire drawdown. That buying is slowing but not stopping. (Unsplash)
While miners are selling to survive and traders are buying insurance against further losses, one entity has been doing the opposite of everyone else: Strategy (MSTR) has kept accumulating bitcoin through the entire 40% decline from October's all-time high.
The numbers are remarkable. Strategy has bought 89,618 BTC in Q1 2026 alone, bringing its total holdings to 761,068 BTC. With two Mondays remaining in the quarter for potential purchase announcements, that Q1 total could grow further. The only quarter in which Strategy added more bitcoin was Q4 2024, when it bought 194,180 BTC during bitcoin's surge to $100,000 after Trump's election victory.

89,618 BTC bought in Q1 2026. The second-largest buying quarter on record - executed into a 40% drawdown. (Source: Strategy.com / CoinDesk / BLACKWIRE)
The funding mechanics behind Q1's accumulation are worth understanding. Recent purchases were partly funded by the Stretch (STRC) perpetual preferred offering, which accounted for up to 15,000 BTC worth of purchases over the past two weeks. However, STRC shares have been trading below their $100 par value this week, which has temporarily disabled that funding mechanism. The company cannot deploy the program until STRC trades back to or above par.
Strategy's common stock (MSTR) has dropped 15% this quarter despite - or perhaps because of - the aggressive accumulation at elevated prices. When the company started buying, bitcoin was trading near its all-time high of $126,000. It has averaged down aggressively through the decline, which means the paper loss on its bitcoin position is significant. The stock market is not impressed by buying an asset 40% above current market prices, even if the thesis is a multi-year hold.
The Strategy playbook remains: issue equity and debt instruments, convert proceeds to bitcoin, hold. The model is entirely dependent on two things continuing to work: capital markets being willing to fund the strategy, and bitcoin eventually recovering to levels that justify the cost basis. At $69,200, with production costs at $88,000, and with the macro environment deteriorating, neither of those assumptions is risk-free right now.
Still, the sheer scale of Strategy's accumulation - 761,068 BTC represents roughly 3.6% of total supply and at current prices is worth approximately $52.6 billion - means it is the most significant single holder on earth and a force that structurally reduces available supply. Whether that supply reduction matters more than the current macro headwinds is the question every Bitcoin analyst is working through this weekend.
Coinbase Goes "Everything Exchange" With Stock Perps

Coinbase is building the 24/7 exchange that traditional finance never could. Stock perps are the latest piece. (Unsplash)
Not all the crypto news this week was about price pain. Coinbase made a significant product move on Friday that deserves attention: the exchange began offering perpetual futures contracts on U.S. stocks to eligible non-U.S. retail and institutional traders.
The contracts cover the Magnificent 7 - Apple, Microsoft, Alphabet, Amazon, Nvidia, Meta, and Tesla - plus perpetual futures tied to SPY and QQQ ETFs in select jurisdictions. The contracts trade 24/7, are cash-settled in USDC, and allow up to 10x leverage on single-stock contracts and 20x on ETF products. All of it runs on the same risk engine supporting Coinbase's existing crypto derivatives markets, with cross-margining across positions.
This is a direct shot at the market Hyperliquid has been building. The decentralized exchange introduced S&P 500 perpetual futures earlier this week and has become a dominant platform for traditional financial instrument contracts that trade around the clock. Coinbase is now entering that space with its centralized infrastructure and regulatory credibility.
The strategic logic is explicit: Coinbase has been publicly pursuing its goal of becoming the "Everything Exchange" - a single platform where traders can access crypto, equities, and commodities under one roof, with shared margin and 24/7 trading. The Iran war, which sent oil-linked perpetuals on Hyperliquid into a frenzy, demonstrated the demand for these products. When geopolitical events happen on weekends, traders who only have access to crypto markets want to be able to hedge equity exposure too.
The non-U.S. restriction is regulatory necessity, not choice. U.S. securities regulations prevent domestic traders from accessing these products without specific licensing. International markets - particularly in Asia and Europe - have significant pent-up demand for round-the-clock equity exposure that traditional exchanges can't provide. Coinbase's move positions it to capture that flow before traditional finance figures out how to respond.
Hyperliquid's response will be telling. The DEX has been remarkably fast at listing new perpetuals and has built a substantial user base that values its fully on-chain, non-custodial structure. The competition between Coinbase's compliant centralized approach and Hyperliquid's permissionless decentralized model is one of the defining product races in financial markets right now.
Timeline: How Bitcoin Got Here - October 2025 to Now
Bitcoin reaches all-time high of $126,000. Mining network hashrate peaks near 1 zetahash. Network difficulty at 155 trillion - an all-time high.
Price begins descent from ATH. Strategy buys 194,180 BTC in Q4 - its largest quarterly purchase. Whale distribution accelerates on the way down.
Hashprice hits all-time low of $28/PH/s/day. Winter Storm Fern triggers 11.16% difficulty drop - 2026's largest adjustment. Mining economics officially broken.
Iran conflict begins. Oil surges 50% in three weeks. Strait of Hormuz disrupted. 20% of global oil and gas flows affected. Bitcoin falls sharply on war risk.
Checkonchain model pegs average bitcoin production cost at $88,000/BTC. The math turns definitively against miners at current prices.
Fed holds rates, dovish lean. Bitcoin rallies to $75,912 over eight consecutive up days. Traders position heavily long on ceasefire hopes. VanEck documents record put premiums.
Trump issues 48-hour ultimatum: reopen Hormuz or face strikes on Iranian power plants. One day after suggesting he was "winding down" military operations.
$299 million liquidated across 84,239 traders. 85% long positions. Bitcoin drops to $69,192. Eight days of gains wiped in hours. Difficulty drops 7.76%. The 48-hour clock is running.
What Comes Next: The 48-Hour Clock and Three Scenarios

Monday evening. That's when the ultimatum expires. Three scenarios, three very different price paths. (Unsplash)
The 48-hour window that Trump set expires Monday evening U.S. time. There are three plausible outcomes, and the market is currently pricing none of them with any conviction.
Scenario 1: Iran complies, Hormuz partially reopens. Probability: LOW. Iran has shown no indication of intent to comply, and doing so under a 48-hour ultimatum would be a significant political capitulation. If this happens - or if credible back-channel negotiations emerge - oil drops sharply, risk assets rally hard, and bitcoin likely recovers toward $72,000-$75,000 quickly on the squeeze of the shorts that opened over the weekend.
Scenario 2: Deadline passes without strikes. Probability: MEDIUM. The most likely outcome if back-channel diplomacy is active but not yet visible to markets. Markets would interpret this ambiguously - the threat wasn't followed through, but the strait remains closed. Bitcoin likely treads water in the $68,000-$71,000 range as traders wait for clarity.
Scenario 3: U.S. strikes Iranian power infrastructure. Probability: MEDIUM-HIGH given current rhetoric. This is genuinely novel territory. Strikes on power plants serving civilian populations would likely trigger international condemnation, potential Iranian retaliation against Gulf oil infrastructure, and a fresh oil price spike. For bitcoin, the initial reaction would almost certainly be negative - another round of liquidations as the risk-off impulse dominates. Whether bitcoin recovers faster than equities and commodities afterward is the open question. Its relative outperformance since the war began suggests some market participants view it as a tail-risk hedge, but that thesis is untested at the specific intensity level of civilian infrastructure strikes.
The miner situation adds a structural dimension to all three scenarios. Even in the best-case (Scenario 1), with oil dropping and bitcoin recovering to $75,000, miners are still operating at a loss relative to the $88,000 production cost. The difficulty will need several more downward adjustments - likely through April - before the average miner's math turns positive again. That means continued miner selling pressure through any near-term relief rally.
The options market's extreme fear reading, historically speaking, is a signal that the worst-case is already being priced. The VanEck data showing 13% average gains in 90 days following similar extremes is a genuine historical pattern. But those historical instances didn't include an active military conflict with a 48-hour countdown to potential civilian infrastructure strikes. This specific combination of inputs has no direct precedent in crypto market history.
What is clear: the market that rallied to $75,912 last week was betting on a world that no longer exists as of Sunday morning. The market that woke up to $69,192 is trying to figure out what world it's actually in. Monday evening will provide the next data point.
Get BLACKWIRE reports first.
Breaking news, investigations, and analysis - straight to your phone.
Join @blackwirenews on TelegramSources: CoinDesk (March 22, 2026) - "Bitcoin drops below $69,200 as Trump gives 48-hour ultimatum on Iran power plants"; CoinDesk (March 22, 2026) - "Bitcoin miners are losing $19,000 on every BTC produced as difficulty drops 7.8%"; VanEck Mid-March 2026 Bitcoin ChainCheck Report; CoinDesk (March 21, 2026) - "Bitcoin options signal extreme fear as downside protection premium hits new all-time high"; CoinDesk (March 20, 2026) - "Bitcoin's latest fear unlocked as rate hike bets rise and bond markets crumble"; CoinDesk (March 21, 2026) - "Strategy set for second-biggest bitcoin buying quarter"; CoinDesk (March 20, 2026) - "Coinbase introduces stock perpetual futures contracts for non-U.S. customers"; CoinGlass liquidation data; Checkonchain Difficulty Regression Model; Luxor Hashrate Index; CME FedWatch Tool.