Already Priced In: Bitcoin Absorbed the Macro Shock. Stocks Are Just Starting to Bleed.
Bitcoin is down 45% from its $126,000 all-time high. Oil topped $100 a barrel. The Fed has flipped from cutting to potentially hiking. $300 million in leveraged longs got liquidated - five times in ten days. And now an asset manager is making the argument that crypto absorbed the shock first, and US equities are the more dangerous bet. Here's the full picture.

Markets on edge: Bitcoin hit a two-week low on March 27, with altcoins and crypto stocks posting some of the session's worst losses. (Photo: Pexels)
The Trade That Broke Down

Oil above $100 per barrel is the macro shock driving the repricing of every risk asset from crypto to equities. (Photo: Pexels)
When the US-Iran war broke out in late February, crypto traders ran the same playbook they've run every time geopolitical chaos arrives: buy bitcoin as a hedge, buy the dip, ride the volatility higher. It was a reasonable thesis. Bitcoin had survived wars, pandemics, exchange collapses, and regulatory blitzes before. The war premium trade was on.
It failed. Badly.
Bitcoin hit an all-time high of approximately $126,000 in early October 2025, as institutional inflows surged and the post-halving supply squeeze played out. By the time US forces were conducting operations around the Strait of Hormuz and oil crossed $100 per barrel, BTC was already bleeding. It had been dropping since October. The war didn't cause the downturn - it accelerated a correction that was already underway.
What traders expected: war premium pushes BTC higher, inflation hedge narrative kicks in, institutional buyers pile in. What happened instead: the war pushed oil above $100, which blew up inflation expectations, which caused the market to reprice Federal Reserve policy from cuts to a potential freeze or even hike, which crushed risk appetite everywhere - crypto included.
According to CoinDesk, bitcoin fell below $67,000 on March 27 with nearly $300 million in long positions liquidated in 24 hours, compared to just $50 million in shorts. That lopsided ratio - 6:1 longs getting wrecked - shows how crowded the bullish positioning had been. Traders expected the war to pump the price. When it didn't, the unwind was brutal.
And that $300 million hit wasn't a one-off. It was the fifth time in ten days that leveraged longs had taken that level of punishment, per CoinDesk data. The market kept buying dips expecting a war premium that never materialized.
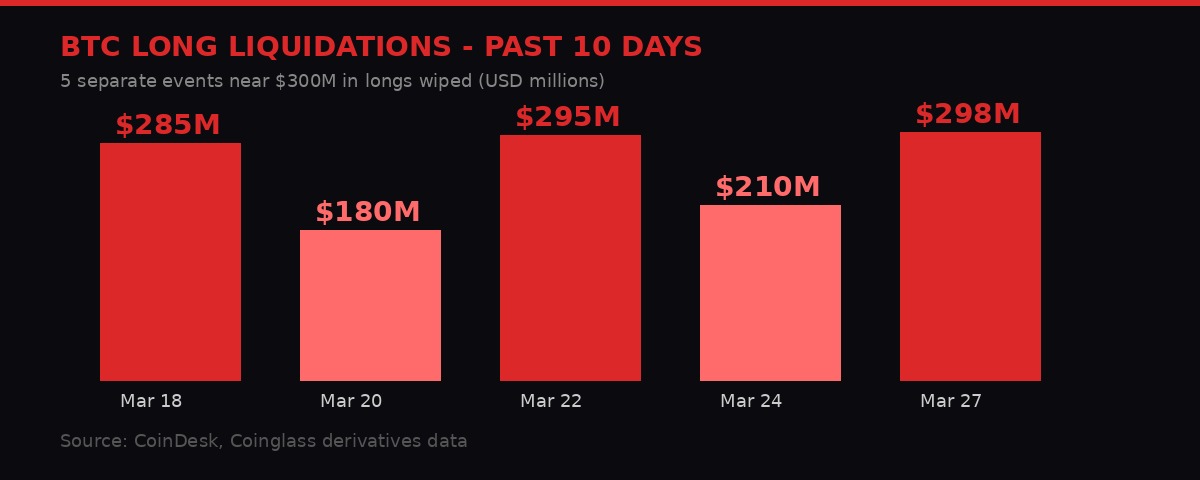
Five separate $285-298M liquidation events in ten days, all targeting overcrowded long positions. The war premium trade kept failing and traders kept re-entering. (BLACKWIRE Research)
The Fed Flip That Changed Everything

The Federal Reserve faces its most complex policy environment since 2022 - rising inflation from oil and a weakening labor market. (Photo: Pexels)
Go back to January 2026. Prediction markets on Polymarket and Kalshi priced a near-3% chance of zero Fed rate cuts for the year. Rate cuts were essentially guaranteed. The soft landing was in. Markets were all-time highs across the board.
Today, those same prediction markets show a 40% probability of zero rate cuts in 2026, according to CoinDesk. That's not a modest adjustment. That's a complete reversal of the macro regime investors had priced in.
The mechanism is simple and brutal: oil at $100 per barrel means gasoline prices spike. Gasoline prices spiking means consumer inflation refuses to fall. Inflation refusing to fall means the Fed cannot justify cutting rates. The Strait of Hormuz chokepoint - which handles roughly 20% of global oil transit - has been partially disrupted by the US-Iran military conflict. Even partial disruption at Hormuz is enough to keep oil supply constrained and prices elevated.
Richmond Fed President Tom Barkin said higher gas costs "could dent consumer spending" while describing hiring conditions as "fragile," per CoinDesk. Philadelphia Fed President Anna Paulson called the Iran war a source of "new risks to both inflation and growth." That's stagflation language - the worst of all monetary policy worlds.
"Energy prices remain closely linked to inflation expectations. The recent surge has led to a meaningful shift in monetary policy pricing, with previously anticipated Federal Reserve rate cuts for the year largely reversing toward expectations of renewed tightening."
- Luke Deans, Senior Research Associate, Bitwise Asset Management
The 10-year Treasury yield hit nearly 4.5% on March 27 before central banker comments pulled it back slightly. The 2-year yield, the most Fed-sensitive instrument, jumped to 4.03% before retreating to 3.91%. These moves are meaningful because the entire valuation architecture of equities - particularly growth and tech stocks - rests on assumptions about long-term rates. When yields spike, future earnings become worth less today. The math gets ugly fast.
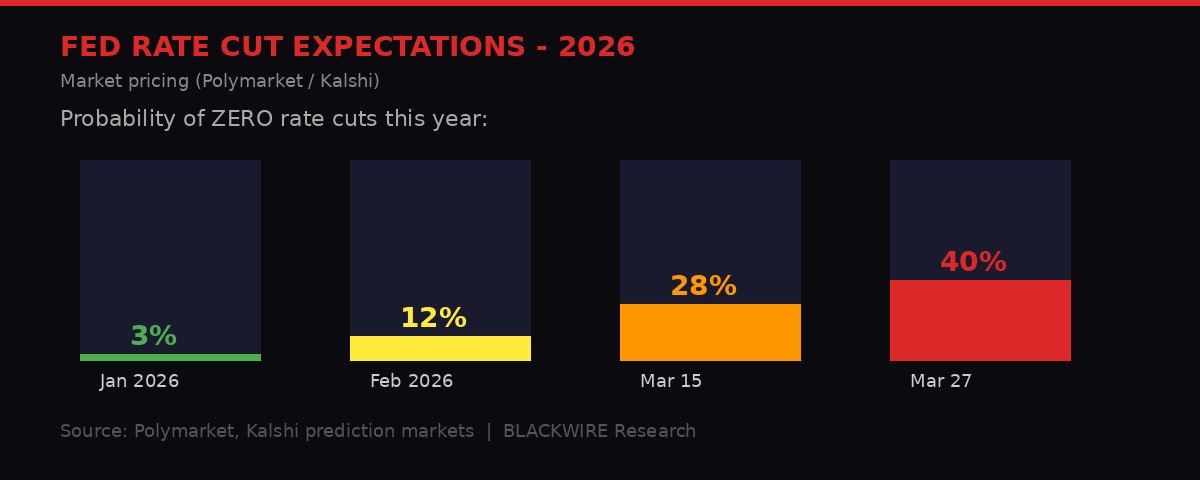
From near-certainty of cuts to 40% chance of zero cuts in three months - the fastest Fed repricing since the 2022 tightening cycle. (BLACKWIRE Research / Polymarket, Kalshi data)
Retail Is Selling. Whales Are Waiting. That's the Critical Difference.

Glassnode on-chain data reveals the clearest picture of who is selling and who is staying quiet. (Photo: Pexels)
On-chain data from Glassnode dissects exactly who has been selling into this drawdown. The answer matters for where bitcoin goes next.
Glassnode's Accumulation Trend Score, which measures the relative behavior of wallet cohorts on a scale from 0 (distribution/selling) to 1 (strong accumulation), tells a stark story about the current selloff, per CoinDesk.
Wallets holding under 1 BTC: Score of 0.11 - near-complete distribution. Small retail holders are panic-selling.
Wallets holding 1-10 BTC: Score of 0.05 - the lowest reading across all cohorts. Retail investors in the $66K-$100K range are aggressively getting out.
Whales holding 1,000-10,000 BTC: Score around 0.5 - neutral. Neither selling hard nor buying.
Entities holding 10,000+ BTC: Mild distribution, but nothing like levels seen when bitcoin was above $90,000 in late 2025.
This pattern - retail capitulating while large holders stay neutral - is typically seen near capitulation bottoms in prior cycles. The dumb money sells. The smart money waits. Then the smart money accumulates when the pain gets extreme enough to shake out the last weak hands.
The pattern also suggests the next significant catalyst for a recovery isn't coming from within crypto. It's going to come from the macro environment - specifically from any signal that oil is cooling, the Fed is backing away from hawkishness, or the Iran conflict is de-escalating. Those are the inputs that matter now, not crypto-native catalysts.
Glassnode Accumulation Trend Score - March 27, 2026
Bitwise's Argument: Bitcoin Has Already Taken the Hit

Bitwise argues bitcoin's Mayer Multiple has been compressing since January - suggesting it has already absorbed what equities are only beginning to price in. (Photo: Pexels)
Here's the contrarian case, and it comes from asset manager Bitwise, which manages billions in crypto investment products.
Bitcoin is down 23.7% year-to-date as of late March. From its October 2025 all-time high of $126,000, it's down roughly 45%. That's a significant compression. Meanwhile, the S&P 500 is down 8.5% from its January peak. The Nasdaq 100 has just entered correction territory, falling more than 10% from its high.
Bitwise's argument, articulated by senior research associate Luke Deans in a CoinDesk interview, is that bitcoin began pricing in tighter financial conditions months before equities did. It's a "liquidity-sensitive, reflexive asset" that tends to lead other risk assets when macro conditions shift.
"Bitcoin, a highly reflexive and liquidity-sensitive asset, typically responds earlier to shifts in risk appetite. This suggests that digital assets began reflecting tighter financial conditions ahead of many traditional risk assets. Relative valuation indicators further reinforce this dynamic."
- Luke Deans, Bitwise Asset Management, via CoinDesk
The evidence Deans cites: the Mayer Multiple - which compares BTC's spot price to its 200-day moving average - has been sitting in the lower historical percentiles since January. That compression suggests BTC has already endured a broad reset in positioning and expectations. Leverage was washed out. Speculative positioning was shaken loose. The asset repriced.
Equities, in contrast, entered 2026 at elevated valuation levels and have only recently begun to adjust to the macro deterioration. The Magnificent Seven - Nvidia, Google, Microsoft, Apple, Meta, Amazon, Tesla - all posted double-digit drawdowns from January peaks, but most still trade at high multiples on earnings that assume benign rate conditions. If rates stay high or go higher, those multiples compress further.
Bitwise also notes that across altcoins, correlations have surged - pointing to a single-factor environment driven entirely by BTC's price. There's no idiosyncratic crypto rally happening right now. Everything moves with bitcoin. That means the recovery, when it comes, will be BTC-led and macro-triggered.
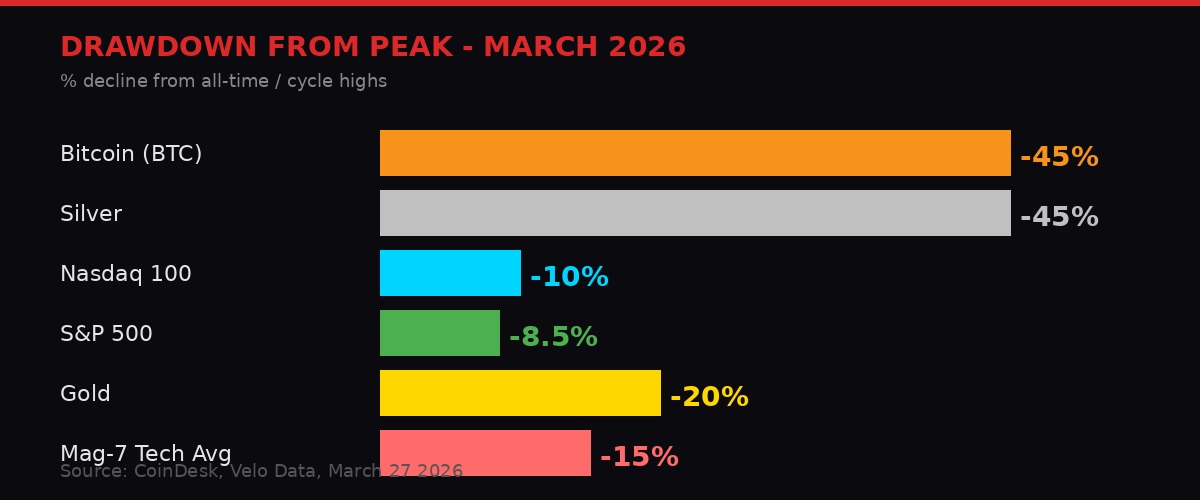
Bitcoin is down 45% from peak - more than silver (45%), gold (20%), and the Nasdaq (10%) - suggesting the deepest repricing of any major asset class. (BLACKWIRE Research)
The Weekly Playbook: Monday Relief, Friday Rout

Since the Iran war began, crypto markets have followed a predictable intraweek pattern - up Monday, down by Friday. (Photo: Pexels)
Since the Iran conflict started in late February, bitcoin has developed a strikingly predictable weekly pattern. Velo Data cited by CoinDesk shows the pattern clearly: strong gains on Monday - averaging around 3% - followed by steady deterioration as the week progresses, with Thursday and Friday seeing the worst losses.
The mechanics are simple. Monday gains come from relief that the weekend didn't bring a catastrophic escalation - no carrier strike, no Hormuz closure, no nuclear incident. The market breathes again. Risk-on trade kicks in. By Thursday, geopolitical anxiety builds as the next weekend approaches. Investors reduce exposure heading into two days of low liquidity. Bitcoin drops. The cycle resets.
This pattern has repeated consistently enough that traders are now actively gaming it. The March 27 Friday selloff - 2.8% average in the pattern - fits precisely. Coinbase (COIN) and Galaxy (GLXY) both dropped nearly 7%. Gemini (GEMI) slid almost 9%. Robinhood (HOOD) fell nearly 6%. Strategy (MSTR) and Twenty One Capital (XXI) - the bitcoin balance sheet plays - plunged 6%.
Even the miners, which increasingly trade as leveraged bets on both BTC price and AI infrastructure deals, got hit hard. Riot Platforms (RIOT), CleanSpark (CLSK), IREN, HIVE Digital, and Hut 8 all posted 5%-8% losses on the session, per CoinDesk market data. MARA and Bitdeer, which had outperformed the day before, gave back all gains and then some.
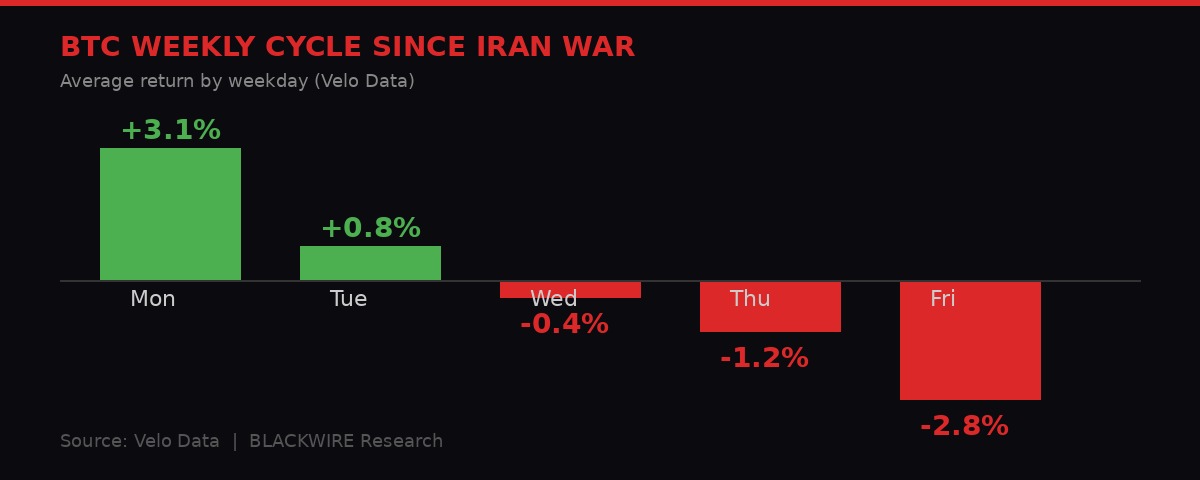
Consistent Monday-to-Friday pattern: average +3.1% on Monday (war didn't escalate relief), -2.8% by Friday (weekend risk reduction). Tradeable, but dangerous to rely on. (BLACKWIRE Research / Velo Data)
The implication is clear: this isn't a market driven by fundamentals right now. It's entirely driven by geopolitical risk perception. Crypto has become a geopolitical fear gauge, not a store of value or a speculative asset. That changes how you trade it - and it changes where the recovery catalyst has to come from.
The ETF Battlefield: Morgan Stanley's 14 Basis Point Grenade

Morgan Stanley filed for a spot bitcoin ETF at 14 basis points - the lowest proposed fee in the market, likely triggering a fee war. (Photo: Pexels)
Amid all the macro chaos, Wall Street quietly kept building its crypto infrastructure. Morgan Stanley filed an amended S-1 with the SEC on March 27, proposing a spot bitcoin ETF priced at 14 basis points annually - the lowest fee on the market if approved, per CoinDesk.
That's below Grayscale's Bitcoin Mini Trust ETF at 0.15%, and significantly below BlackRock's iShares Bitcoin Trust (IBIT) at 25 basis points. On paper, the difference looks narrow. In practice, when all bitcoin ETFs offer near-identical exposure - each holds BTC and tracks its price - cost is one of the few variables advisors can actually act on.
A financial advisor can move $100 million in client exposure from IBIT to MSBT with a single trade, maintaining the same bitcoin exposure while cutting annual fees by $110,000. Multiply that by Morgan Stanley's massive adviser network overseeing trillions in client assets and the potential for rapid AUM capture becomes obvious.
The fee filing also signals something larger: the first spot bitcoin ETF issued directly by a major US bank. Not BlackRock. Not Fidelity. A bank. If regulators approve - and the NYSE has already issued a listing notice for MSBT, suggesting approval is expected - it changes how financial advisers think about allocating to bitcoin. This isn't a specialty crypto product anymore. It's a bank product.
The timing is deliberately adversarial. Morgan Stanley is entering when bitcoin ETF outflows hit $171 million on March 27 - the largest single-day exit in three weeks, per CoinDesk. That's not a coincidence. It's positioning. File the ETF at the bottom of the cycle, capture the narrative, be ready when institutional flows return.
Spot Bitcoin ETF Landscape - Fee Comparison (March 2026)
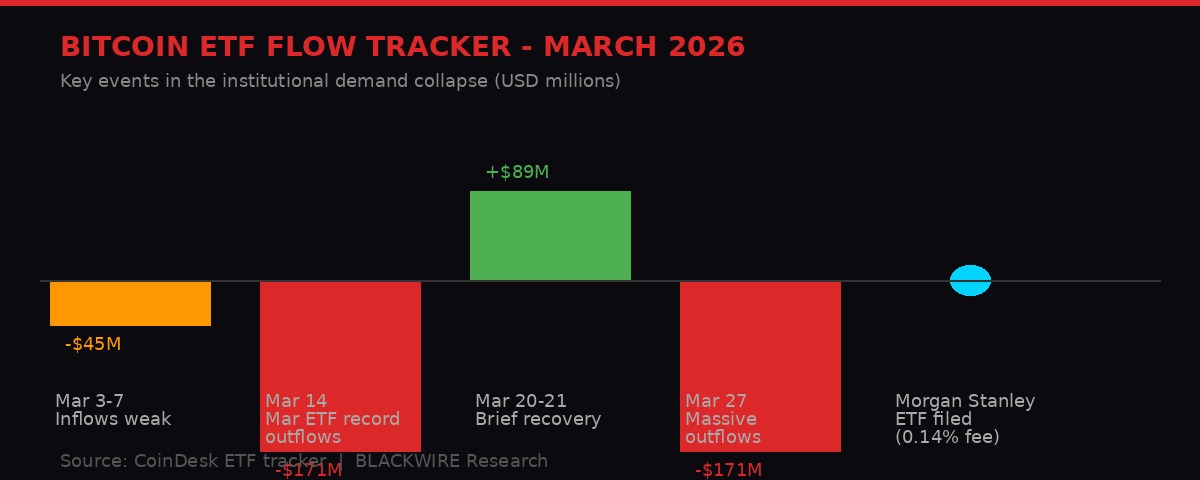
ETF outflows spiked to $171M on March 27 - same day Morgan Stanley's low-fee filing landed. Tactical timing or coincidence? (BLACKWIRE Research)
The Macro Trap: What Needs to Break for BTC to Recover

The Strait of Hormuz chokepoint handles roughly 20% of global oil transit. Any reopening signal could unlock a significant risk-asset relief rally. (Photo: Pexels)
Let's be precise about what needs to happen for bitcoin to recover meaningfully.
The current selloff has three drivers, each feeding the others: high oil prices, Fed hawkishness, and geopolitical risk. To break the loop, at least one of those drivers needs to shift materially. Here's what each would require:
Oil cools: The Strait of Hormuz needs to reopen to full traffic, or a ceasefire in the US-Iran conflict needs to reduce the geopolitical risk premium in crude. That would pull oil back toward $80, ease inflation expectations, and allow the Fed to reinstate rate cut signals. This is the most powerful catalyst and the most uncertain.
Fed communicates patience: Even without oil dropping, any Fed signal that it will not hike - that it will hold rates steady and wait - could halt the yield spike that's crushing risk assets. The two-year yield already snapped back from 4.03% to 3.91% after Barkin and Paulson's remarks on March 27, showing how sensitive markets are to any hint of Fed dovishness.
Retail capitulation completes: The Glassnode data shows retail holders are already in heavy distribution mode. When retail runs out of coins to sell - when the last weak hands have exited - the selling pressure abates even without a new catalyst. This is a slower, more grinding recovery path.
What isn't going to drive recovery: crypto-native news, ETF approval timelines, or any single company pivot. The asset is entirely macro-correlated right now. The dominance of geopolitical narrative over crypto fundamentals is near-total.
Bitwise's framework suggests the sequence matters. If BTC has already done the heavy repricing work while equities are still early in their adjustment, then any macro improvement should benefit BTC relatively more than stocks - both because BTC has more mean-reversion potential from compressed levels and because stocks still need to fully absorb the rate environment shift.
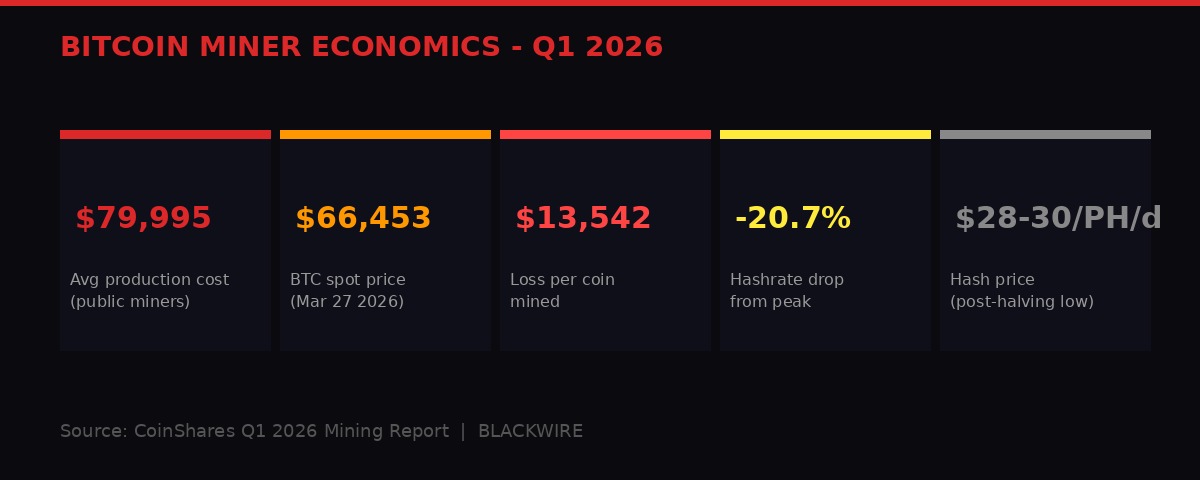
Miner economics remain deeply negative - an average cash cost of $79,995 versus a spot price of $66,453. But this is its own catalyst: hashrate dropping reduces difficulty, eventually improving miner margins. (BLACKWIRE Research)
Timeline: Six Weeks of Macro Carnage
The $17 Trillion Wipeout and What It Means

$17 trillion erased from peak values across Mag-7, gold, silver, and bitcoin - the broadest multi-asset drawdown since 2022. (Photo: Pexels)
The aggregate damage from peak levels across major assets is staggering. CoinDesk market data puts the total market cap wiped out from peak levels at roughly $17 trillion across the Magnificent Seven tech stocks, gold, silver, and bitcoin combined.
That's not a crypto crisis. That's a global repricing event. Bitcoin hit its all-time high in early October 2025. Gold and silver and US equities peaked in late January. Since peak levels, here's the damage: Bitcoin down approximately 45%. Silver down approximately 45%. Gold down roughly 20%. The Magnificent Seven all in double-digit drawdowns. The Nasdaq 100 now officially in correction territory, trading more than 10% below its January all-time high. The S&P 500 down 8.5%.
The 60/40 portfolio - the traditional allocation of 60% stocks, 40% bonds - has offered little protection. The iShares 20-Year Treasury Bond ETF (TLT) was down 5% over the past month through March 27, while stocks simultaneously fell. When both legs of the classic diversification trade drop together, investors have nowhere to hide except cash and energy assets - which is why oil itself has been one of the few performing assets.
The irony: the asset down the most - bitcoin at -45% from peak - is the one Bitwise argues has already done the repricing work. Whether that thesis proves out depends on a single question: will the macro environment deteriorate further, or has the worst already been priced?
No one rings a bell at the bottom. But the on-chain data, the options market, and the Mayer Multiple are all pointing toward a compressed, oversold asset where the next marginal move requires macro inputs, not crypto inputs. The moment oil drops significantly, or the Fed says something dovish, or ceasefire talks in the Iran conflict gain traction - watch BTC's reaction. It will be faster and sharper than anything happening in equities.
The trade that failed was "Iran war = BTC rally." The trade being set up is "Iran peace = BTC oversold relief." But nobody knows when peace comes. Until then, Monday mornings keep getting sold by Friday.
Get BLACKWIRE reports first.
Breaking news, investigations, and analysis - straight to your phone.
Join @blackwirenews on Telegram