Six Months of Blood: Bitcoin's Historic Losing Streak and the Wall of Pain That Built It
BTC needs to rally 1% in 15 hours to avoid matching a record last set in January 2019. The odds are not in its favor.

The numbers don't lie. Six consecutive red monthly candles tell the story. (Unsplash)
Bitcoin is about to do something it hasn't done since the crypto winter of 2018-2019: close six consecutive months in the red.
As of Tuesday afternoon UTC, BTC sits at $66,600. It needs to climb above $67,300 - a move of roughly 1% - before the March candle closes to break the streak. With Brent crude at $107, U.S. real yields at their highest since June 2025, futures open interest down 18% year-to-date, and the most popular trade on Deribit being a $60,000 put, the smart money isn't betting on a miraculous last-minute recovery.
This is not a story about one bad month. This is a story about six of them, each driven by different pressures, all compounding into what might be the most structurally hostile environment for bitcoin since the collapse of FTX in November 2022.
Let's walk through the wreckage, month by month, and understand why the floor may not be in yet.
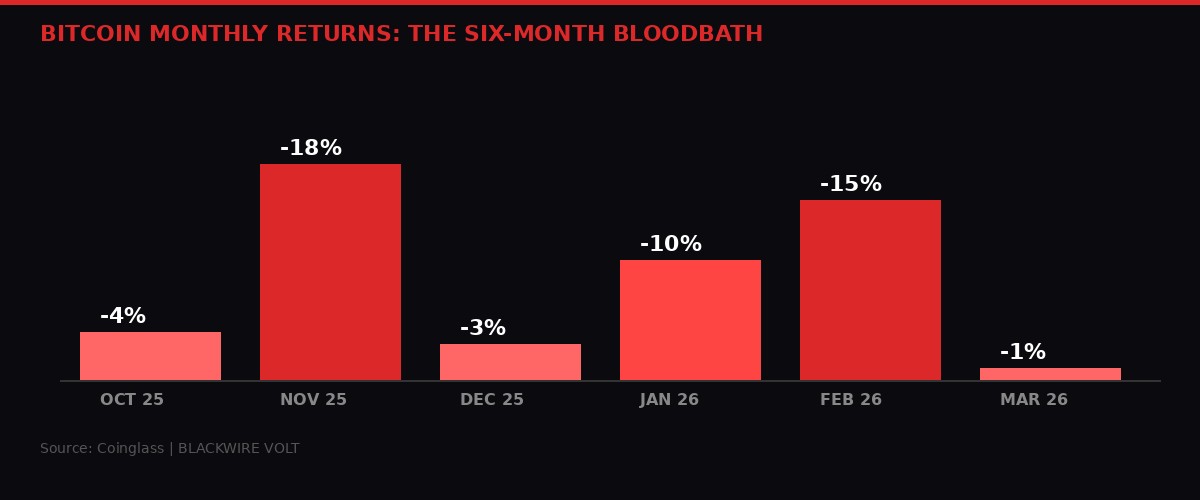
Six months of red: Bitcoin's consecutive losing streak matches the 2018-2019 record. (BLACKWIRE VOLT)
The Streak: October 2025 Through March 2026
According to Coinglass data, the bloodletting began in October 2025 with a relatively modest 4% decline. At the time, most analysts dismissed it as healthy consolidation after bitcoin's post-halving run. The April 2024 halving had cut block rewards to 3.125 BTC, and the expected supply shock was supposed to propel prices well beyond six figures.
November changed the narrative. An 18% crash - the worst single month since June 2022 - shattered confidence. Institutional flows reversed. Spot ETF outflows began in earnest. The S&P 500 peaked and started its own decline, dragging risk assets into a broad-based selloff driven by fears that the Federal Reserve would hold rates higher for longer than markets had priced in.
December offered a brief reprieve in percentage terms - only a 3% dip - but the damage was psychological. Bitcoin had failed to hold $80,000, a level many had circled as the floor for the post-halving cycle. The realization that this was not a typical bull market correction, but something more structural, started to seep into crypto Twitter and institutional research desks alike.
January 2026 brought a 10% decline as the new year opened with zero appetite for risk. Rate cut expectations, which had fueled much of the 2024-2025 rally, were being systematically unwound. The 10-year Treasury yield climbed. Real yields - the inflation-adjusted return on government bonds - began their march higher, making bitcoin's zero-yield proposition look increasingly unattractive.
February was savage. A 15% drop coincided with the onset of the U.S.-Israel military campaign against Iran on February 28. Brent crude spiked above $100 within days. The Strait of Hormuz, through which roughly 20% of global oil supply passes, was effectively shut down. Risk assets cratered. Bitcoin, despite its "digital gold" narrative, fell alongside equities in a classic risk-off liquidation cascade.
March - the month that ends today - has been the mildest at roughly -1%. But this modest figure masks extraordinary intra-month volatility. BTC spiked to $68,300 early Tuesday on reports that Trump was willing to end the Iran conflict without the Strait being reopened, only to crash back to $66,500 after Israeli officials said they were prepared to "keep operating for weeks to come."
The last time bitcoin recorded six consecutive red months was August 2018 through January 2019. That period was followed by five straight green months, offering some historical precedent for a recovery. But the conditions that produced that turnaround - the Fed pivoting to rate cuts in 2019, no active shooting war in the Middle East, oil below $60 - simply do not exist today.

Brent crude above $107. The Iran war's impact on energy markets is choking risk appetite across every asset class. (Unsplash)
The Macro Vise: Oil, Real Yields, and the Fed Trap
Understanding bitcoin's predicament requires understanding the macro forces pinning it down. There are three, and they reinforce each other.
Oil at $107 and the Inflation Tax
Brent crude has traded above $100 per barrel for over a month now, driven by the Iran conflict and the effective closure of the Strait of Hormuz. This is not a supply disruption that can be quickly resolved. The U.S. Strategic Petroleum Reserve, already depleted to its lowest level since 1983 after the 2022 drawdowns, offers limited buffering capacity.
High oil prices function as a tax on the global economy. They push up transportation costs, manufacturing costs, food costs. They feed directly into headline inflation numbers. And they complicate every central bank's calculus on when - or whether - to cut interest rates.
For bitcoin, the chain of causation is straightforward: higher oil leads to higher inflation, which leads to higher-for-longer rates, which leads to higher real yields, which leads to less demand for zero-yielding risk assets. Bitcoin sits at the end of that chain, taking the full force of every link.
Real Yields at 2.02% and Climbing
The yield on 10-year Treasury Inflation-Protected Securities (TIPS) has risen more than 30 basis points since the Iran conflict began on February 28, from approximately 1.70% to 2.02% as of Tuesday. Last week it hit 2.12%, the highest since June 2025.
This number matters more than almost any other metric for bitcoin's near-term trajectory. TIPS yield represents the real - inflation-adjusted - return investors can earn by simply holding U.S. government bonds. When that number is high and rising, the opportunity cost of holding a volatile, zero-yield asset like bitcoin becomes enormous.
"Bitcoin's situation is unlikely to improve without lower Fed rates and healthier liquidity, as rising real yields drive capital away from non-yielding assets." - Bitfinex Alpha Report, March 31, 2026
Michael J. Kramer of Mott Capital Management added that the 10-year real yield is rising faster than the 5-year, implying the market is pricing tighter financial conditions further out the curve - not a temporary squeeze, but a sustained shift. "Oil prices are in the driver's seat," he wrote in a Monday note, "and they are tightening financial conditions across the broader market complex."
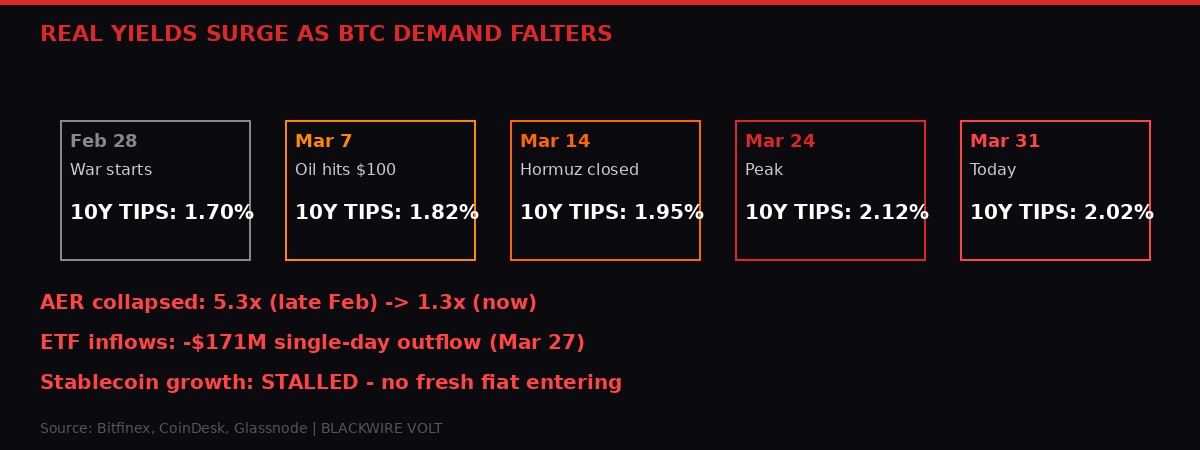
10-year TIPS yield has surged 30+ basis points since the Iran war began, crushing demand for zero-yield assets. (BLACKWIRE VOLT)
The Fed Trap
The Federal Reserve is caught. Inflation is running hot again, driven by energy costs. The labor market, while cooling, hasn't cracked enough to justify rate cuts. And the geopolitical environment makes any dovish pivot look premature and politically untenable.
Rate hike bets are building not just for the Fed, but for the Bank of Japan as well, according to CoinDesk reporting from March 30. A coordinated global tightening cycle, driven by war-induced commodity inflation, is the worst possible backdrop for speculative assets.
Bitcoin bulls had spent the first half of 2025 riding the wave of anticipated rate cuts. Those cuts never came. Now they're staring at the possibility that the next move might be a hike - and the options market is pricing that fear in real time.
Derivatives: The $60,000 Put and the Capitulation Signal
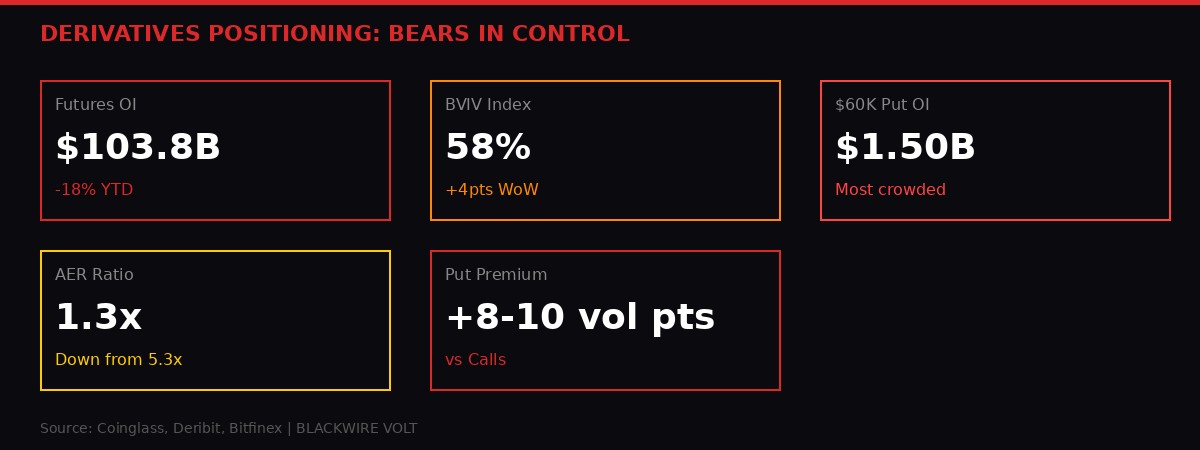
Open interest collapsing, volatility rising, and the $60K put is the most crowded trade on Deribit. (BLACKWIRE VOLT)
If you want to know what the sophisticated money thinks, don't look at price. Look at derivatives. And the derivatives market is screaming one word: protection.
Cumulative industry-wide crypto futures open interest dropped over 3% in 24 hours to $103.79 billion on Tuesday, continuing a brutal year-to-date decline of more than 18%. This isn't selective - OI has declined across BTC, ETH, SOL, and XRP futures, indicating capital outflows across the board.
The exception is telling: ZEC, the privacy coin, is the only major token showing bullish futures positioning, with rising OI, positive funding rates, and positive cumulative volume delta. Draw your own conclusions about what that signals about market participants' desire for financial privacy in a world of expanding surveillance and sanctions.
Bitcoin's 30-day implied volatility index (BVIV) has ticked up to 58% from 54% late last week, breaking above its 50-day average. This signals the market expects more turbulence, not less. Options traders are paying up for optionality because they believe larger moves are coming.
The direction they're betting on is down. On Deribit, bitcoin risk reversals out to the June expiry show a strong bias for put options, which trade at an 8 to 10 volatility-point premium to equivalent calls. This is a significant skew. In a neutral market, puts and calls trade at roughly equal implied volatility. An 8-10 point premium means the market is willing to pay substantially more for downside protection than upside exposure.
The single most popular trade? The $60,000 bitcoin put, with a total open interest of $1.50 billion. That is the level where the smart money has planted its flag as the next support - and simultaneously, the level they're hedging against reaching. When that much capital is concentrated in a single strike, it can become self-fulfilling. Market makers who sold those puts need to dynamically hedge by selling bitcoin as price approaches $60,000, potentially accelerating any decline.
At the other end of the spectrum, DOGE has the most negative 24-hour cumulative volume delta among major tokens - the retail favorite is getting liquidated hardest.
The Demand Drought: ETFs Dry Up, Stablecoins Flatline

Institutional appetite has evaporated. ETF outflows and stalled stablecoin growth tell the story of a market running on fumes. (Unsplash)
The supply side of bitcoin is mechanical and predictable: approximately 450 new BTC are mined every day, roughly one block every 10 minutes at 3.125 BTC per block since the April 2024 halving. That's about $30 million in new supply hitting the market daily at current prices.
The question is always demand. And by every metric that matters, demand is collapsing.
Bitfinex's absorption-to-emissions ratio (AER) - which measures institutional demand relative to daily miner issuance - has collapsed to just 1.3x, down from 5.3x in late February. To translate: a month ago, institutional buying was absorbing more than five times the daily miner output. Today, it's barely absorbing more than what miners produce. The margin is razor-thin.
"The current reading of 1.3x places the market firmly within this passive absorption/erosion band. Here, demand still marginally exceeds miner issuance, but only just." - Bitfinex Alpha Report
Spot ETF flows have turned negative. On March 27, investors yanked $171 million from bitcoin ETFs in the largest single-day outflow in three weeks. The pattern isn't a one-off - it's a trend. After the euphoria of 2024's ETF launches and the record inflows that followed, institutional appetite has systematically evaporated as macro conditions deteriorated.
Stablecoin growth has stalled entirely. This is perhaps the most alarming signal of all. Stablecoin market cap growth is the best proxy for fresh fiat entering the crypto ecosystem. When it flatlines, it means no new money is coming in. The market is cannibalizing itself - existing participants shuffling capital between positions, with no fresh demand to push prices higher.
For any meaningful rally, Bitfinex analysts say the market would need "strong, consistent inflows - the kind we saw in late 2024 and the first half of 2025." Given the macro backdrop, that seems unlikely absent a major geopolitical de-escalation or a surprise Fed pivot.
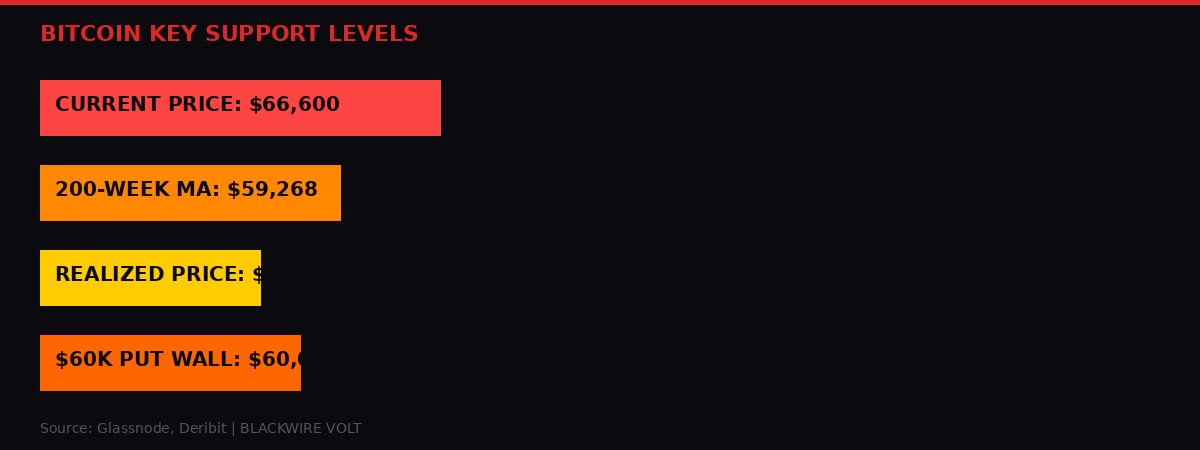
BTC still holds above its 200-week moving average and realized price - but every prior bear market broke both. (BLACKWIRE VOLT)
The Support Levels That Haven't Broken - Yet
Bitcoin maximalists will point to one crucial detail: in every prior bear market, BTC has fallen below both its 200-week moving average and its realized price. It hasn't done so in this cycle.
The 200-week moving average sits at $59,268, according to Glassnode data. The realized price - the average on-chain cost basis of all bitcoin, weighted by last movement - sits at $54,177. Both remain comfortably below the current price of $66,600.
This is either a sign that the market is more resilient than previous cycles suggested, or a sign that the real pain hasn't arrived yet.
The historical pattern is instructive. In the 2018-2019 bear market, bitcoin spent months below both the 200-week MA and realized price before bottoming at $3,200 in December 2018. In the 2022 bear, BTC broke below both after the FTX collapse, bottoming at $15,500. In each case, the bottom came with a violent capitulation event that flushed out leveraged positions and forced a generational buying opportunity.
No such event has occurred in this cycle. The decline has been methodical, grinding, structural - driven by macro forces rather than a single catalyst. That's arguably more dangerous, because it erodes confidence slowly rather than creating the kind of panic flush that marks a bottom.
If the $60,000 put wall on Deribit gives any indication, the next level the market is watching is clear. A break below $60,000 would likely accelerate into a test of the 200-week MA at $59,268. Below that, the realized price at $54,177 becomes the last line of defense before the market enters true capitulation territory.
Nakamoto Holdings: When the Treasury Strategy Becomes a Trap
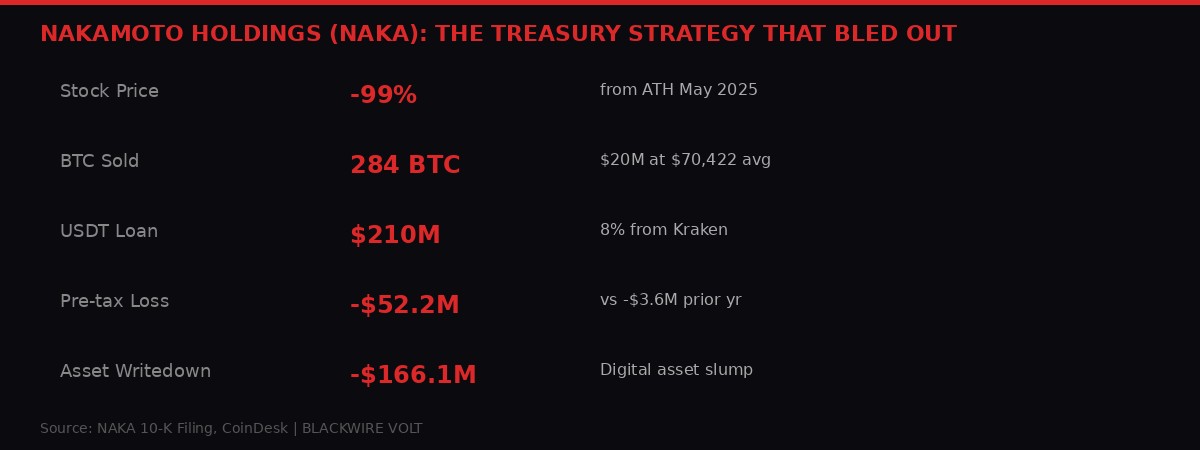
Down 99% from its all-time high. NAKA's bitcoin treasury strategy met the worst bear market possible. (BLACKWIRE VOLT)
The poster child for the danger of corporate bitcoin treasury strategies just filed its annual report, and the numbers are devastating.
Nakamoto Holdings (NAKA), founded by Bitcoin Magazine's David Bailey, disclosed that it sold 284 BTC in March for $20 million - roughly 5% of its holdings - at an average price of $70,422 per bitcoin. The company said proceeds would fund operations and working capital following its acquisitions of BTC Inc. and UTXO.
Let that sink in. A company whose entire strategy is accumulating bitcoin was forced to sell bitcoin to keep the lights on.
NAKA went public in May 2025 by merging with KindlyMD, a healthcare provider, and raised $710 million to pursue its bitcoin treasury strategy. The stock has since fallen 99% from its all-time high. The company reported a pre-tax loss of $52.2 million for fiscal 2025, versus $3.6 million the prior year, driven primarily by a $166.1 million writedown on its digital asset holdings.
Making matters worse, NAKA has an $210 million USDT loan from Kraken at 8% interest, secured by a majority of its bitcoin. At current prices, the margin is thin. Further bitcoin declines would either require additional collateral or trigger forced liquidations - adding more selling pressure to a market already drowning in it.
The MicroStrategy playbook - which inspired dozens of imitators including NAKA, Metaplanet, and others - was designed for a rising market. In a falling market, it becomes a death spiral: bitcoin drops, stock drops, company needs cash, sells bitcoin, bitcoin drops further. Bailey's company is the first high-profile casualty of this cycle, but it likely won't be the last.
KuCoin: The Final Chapter of the Offshore Exchange Era
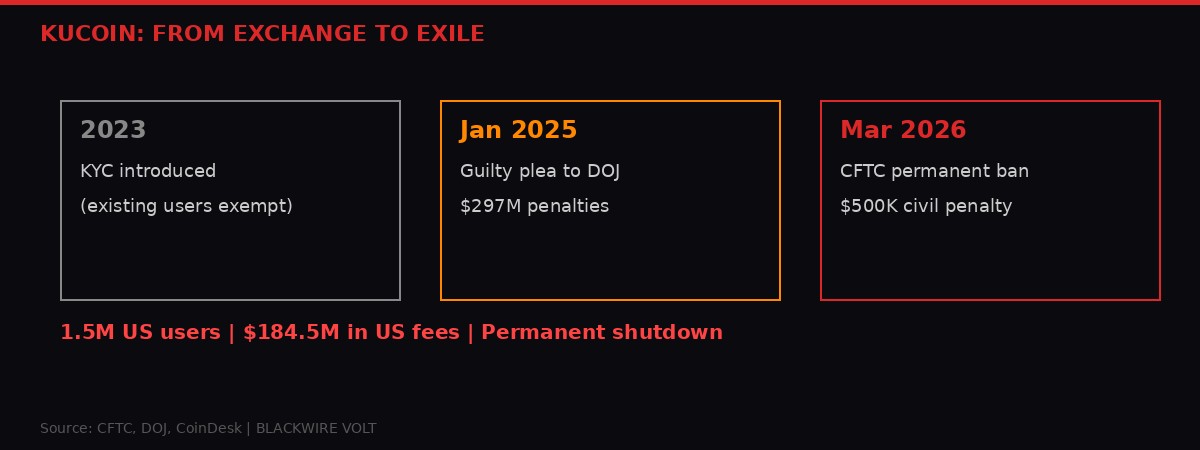
From 1.5 million US users to zero. KuCoin's permanent ban caps years of regulatory escalation. (BLACKWIRE VOLT)
While markets bled, regulators kept swinging. On Tuesday, a federal court approved a CFTC consent order permanently barring KuCoin operator Peken Global Limited from serving U.S. users, unless it registers as a foreign board of trade - a process so onerous it effectively means never.
The order imposes a $500,000 civil penalty on top of the nearly $297 million in penalties and forfeitures from KuCoin's January 2025 guilty plea to operating an unlicensed money transmitting business. More importantly, it converts what had been a temporary two-year withdrawal from the U.S. market into an indefinite, permanent ban.
KuCoin had approximately 1.5 million registered U.S. users and generated at least $184.5 million in fees from them. The exchange didn't introduce know-your-customer requirements until August 2023 and critically never applied them retroactively to existing accounts - a gap that became the centerpiece of enforcement.
The CFTC didn't seek disgorgement, citing KuCoin's cooperation and the forfeiture already imposed in the criminal case. The relatively small civil penalty reflects that the real punishment was already delivered by the DOJ.
The KuCoin saga is significant beyond one exchange. It represents the closing of a chapter in crypto's history - the era when offshore exchanges could serve U.S. customers with impunity, collecting hundreds of millions in fees while ignoring registration requirements and AML obligations. That era is over.
The enforcement methodology itself was notable: a sequential process moving from criminal prosecution to civil market bans, using the DOJ as a hammer and the CFTC as a lock. This playbook is now available for use against any exchange that tries the same strategy. The deterrent effect is real.
Bright Spots in the Darkness: Where Capital Is Actually Flowing

Not everything in crypto is bleeding. Stablecoin infrastructure and institutional market-making are attracting real capital. (Unsplash)
Not all crypto news on Tuesday was red. Two fundraising announcements suggest that while speculative capital is fleeing, infrastructure capital is arriving.
Keyrock, the Brussels-based digital asset market maker, closed a Series C led by SC Ventures (Standard Chartered's venture arm) with participation from Ripple, at a valuation of $1.1 billion. The company, which operates across 80+ centralized and decentralized trading venues, said it would use the funds for balance sheet strengthening, product expansion, and acquisitions. When Standard Chartered's venture arm leads a billion-dollar round for a crypto market maker during a bear market, it tells you something about where institutional conviction lies: not in tokens, but in the plumbing.
OpenFX, a stablecoin-powered cross-border payments startup, raised $94 million from Accel, Lightspeed Faction, Pantera, and others at a $500 million valuation. Founded in 2024, the company now handles over $45 billion in annualized payment volume - up from $4 billion a year ago. That's real business growth, not speculation, and it's happening in stablecoins - the one part of crypto that has found genuine product-market fit regardless of bitcoin's price action.
Hashdex also launched options on its diversified crypto ETF (NCIQ) on Nasdaq, providing the first options coverage for a multi-asset crypto basket ETF. The product holds BTC, ETH, XRP, SOL, ADA, LINK, and XLM, with nearly $100 million in AUM. The options launch enables institutions to hedge positions they previously could only hold without a safety net - a structural improvement in market infrastructure even as speculative markets deteriorate.
The pattern is clear. Speculative capital is exiting. Infrastructure capital is entering. This is what a mature market looks like during a downturn - the tourists leave, but the builders stay and keep pouring concrete.
What Happens Next: The April Scenarios

Q2 opens tomorrow. The question is whether bitcoin finds a floor or enters true capitulation territory. (Unsplash)
Tomorrow is April 1. Q2 opens. And the market faces three potential paths forward.
Scenario 1: Geopolitical De-escalation (Bull Case)
Trump signals from Tuesday suggest some willingness to end the Iran conflict. If a ceasefire materializes and Hormuz reopens, oil collapses back below $80, inflation expectations reset, and the Fed gets room to signal cuts. Bitcoin could see a violent short squeeze above $75,000, potentially retesting $80,000. The $60,000 put wall becomes worthless. This is the scenario that triggered Tuesday's spike to $68,300 before Israeli officials poured cold water on it. Probability: low, given Israeli statements about continuing operations "for weeks to come."
Scenario 2: Grinding Stagnation (Base Case)
The war continues at current intensity. Oil holds between $100-$110. Real yields stay elevated. Bitcoin oscillates between $62,000 and $70,000 with decreasing volume and open interest. ETF flows remain negative to flat. The market slowly loses participants as boredom and frustration compound. April closes marginally red, extending the streak to a historic seven months - something that has never happened in bitcoin's history. Probability: highest.
Scenario 3: Capitulation Break (Bear Case)
An escalation in the Middle East - perhaps an attack on Kharg Island or further closure of the Strait - sends oil above $120. Real yields spike past 2.5%. The $60,000 put wall triggers a gamma cascade as market makers hedge by selling spot. Bitcoin breaks below $60,000, tests the 200-week MA at $59,268, and potentially flushes down to realized price at $54,177. Nakamoto-style companies with bitcoin-backed loans face margin calls, creating forced selling. This would be the capitulation event that hasn't happened yet - brutal, but historically the kind of event that marks a generational bottom. Probability: moderate, and rising with each day the war continues.
Key Numbers to Watch in April
- $67,300 - March open. A close above this breaks the losing streak.
- $60,000 - The $1.5B put wall on Deribit. Gamma risk below this level.
- $59,268 - 200-week moving average. Never held in a bear market.
- $54,177 - Realized price. On-chain cost basis. Below this = deep capitulation.
- 2.02% - 10-year TIPS yield. Rising = more BTC pain.
- $107/bbl - Brent crude. Above $100 = inflation sticks = no rate cuts.
- 1.3x - AER ratio. Below 1x = miner selling exceeds institutional buying.
Six months of red. Oil above $100. Real yields surging. Derivatives loaded for more downside. ETF flows negative. Stablecoin growth stalled. Corporate treasury strategies bleeding out.
The case for a bitcoin recovery exists - it's called a ceasefire. Everything else on the board points down.
The market doesn't care about your halving cycle charts or your stock-to-flow models. It cares about real yields, oil prices, and whether the Strait of Hormuz is open for business. Until those variables change, bitcoin is stuck in the heaviest gravitational field it has faced since FTX.
Good luck out there. You'll need it.
Get BLACKWIRE reports first.
Breaking news, investigations, and analysis - straight to your phone.
Join @blackwirenews on Telegram