The Fed Trap: Oil Crosses $100, Rate Cuts Die, and Bitcoin Already Priced It In

Market Snapshot - March 28, 2026
How $100 Oil Became the Fed's Nightmare

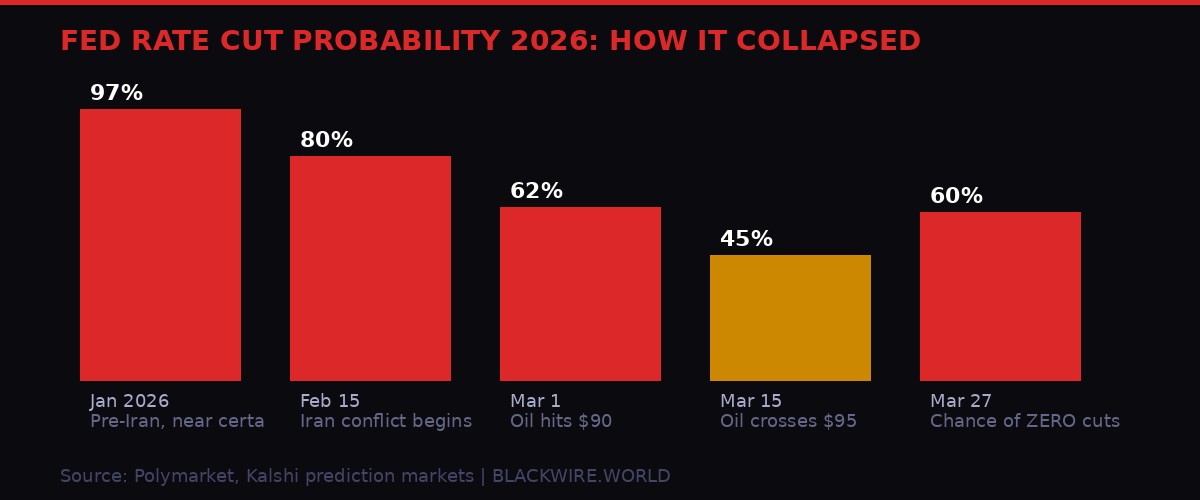
At the start of 2026, the rate cut trade was the most crowded bet on Wall Street. Prediction markets had the odds at near-97% that the Federal Reserve would ease at least once before December. Inflation had cooled, growth was holding, and the political pressure from the White House was running hot. A cut felt like a matter of when, not if.
Then the bombs fell on Iranian nuclear sites in late February. The U.S. Air Force, alongside Israeli strikes, hit Fordow, Natanz, and Isfahan. The IRGC closed the Strait of Hormuz. Container ships rerouted. Tankers vanished from AIS tracking. Within 72 hours, oil was trading above $95. Within three weeks, it crossed $100.
The math flipped instantly. Energy costs drive transportation, drive food, drive construction, drive almost everything that shows up in CPI. The Fed cannot cut rates into a supply-shock inflation spiral without risk of re-igniting the 2021-2022 cycle it spent two years fighting.
Philadelphia Fed President Anna Paulson put it plainly when she told reporters that the Iran conflict had created "new risks to both inflation and growth." Richmond Fed's Tom Barkin echoed that read, warning higher gas costs could "dent consumer spending" while calling the hiring environment "fragile." The dual mandate - maximum employment, price stability - was now pulling in opposite directions simultaneously.
By March 27, the Polymarket and Kalshi prediction markets had flipped completely. From 97% certainty of at least one cut to a 40% chance of zero cuts for the entire year. That's not a repricing. That's a demolition of the 2026 macro thesis.
The 10-year Treasury yield, which had ticked toward 4.5% on Friday morning, pulled back sharply after the Fed officials spoke - a rare case of bonds rallying on ambiguity. The two-year yield, which directly prices Fed policy expectations, swung from 4.03% down to 3.91% intraday, reflecting genuine confusion about which direction the central bank will be forced to move.
Traders who came into 2026 holding rate-sensitive positions - leveraged tech, growth equities, duration bonds - were getting hit from every angle. The playbook that worked in 2024 had become a liability.
$17 Trillion Gone: The Magnificent Seven Take the Hit

The headline number is $17 trillion. That's the combined market cap destruction across the Magnificent Seven - Nvidia, Apple, Microsoft, Google, Meta, Amazon, Tesla - plus gold, silver, and bitcoin, measured from their respective peaks.
Bitcoin hit its all-time high in early October 2025 at $126,000. At the time, it was the talk of every earnings call, every wealth management conference, every financial news ticker. Spot ETFs had just crossed $100 billion in AUM. Strategy (formerly MicroStrategy) held over 500,000 BTC. Twenty One Capital was being spun up as a bitcoin pure-play. Miners were trading like they printed money.
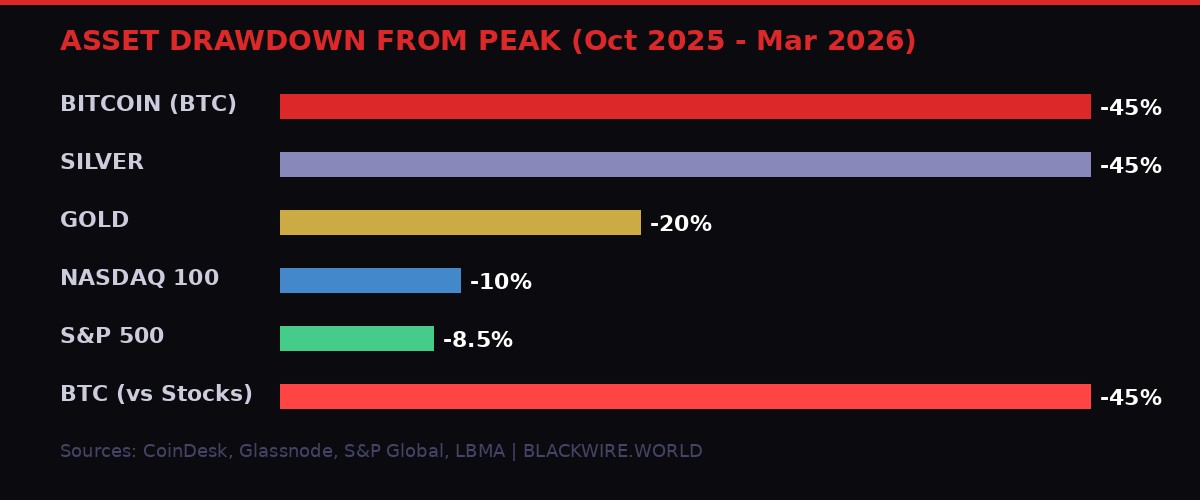
Then the slow drain began. Gold, silver, and U.S. equities peaked in late January 2026 - three months after bitcoin. By the time equities rolled over, crypto had already been in freefall for four months. Bitcoin is now down 45% from its peak. Silver has fallen 45% from its January high. Gold is off 20%. The Nasdaq 100 has corrected 10%.
The iShares 20+ Year Treasury Bond ETF (TLT) is down around 5% over the past month since the conflict broke out - a sign that even bonds, the traditional crisis hedge, are struggling in an environment of simultaneously rising inflation and geopolitical uncertainty. The classic 60/40 portfolio - 60% equities, 40% bonds - has failed as a hedge for the third time in four years.
The S&P 500 is down 8.5% from its January peak and threatening to enter official correction territory. The broad-based selloff across asset classes reflects a market trying to price something genuinely novel: a stagflationary shock triggered not by domestic policy error but by a kinetic military conflict in the world's most critical oil chokepoint.
Crypto Stocks in Freefall: The Friday Playbook

Since the Iran conflict started in late February, crypto markets have developed a predictable weekly pattern. Mondays bring relief rallies - averaging around 3% - as traders exhale that the weekend didn't produce a "Black Monday" catastrophe. By Thursday and Friday, that optimism evaporates. Risk reduction ahead of the weekend, compounded by fading hopes that the Strait of Hormuz will fully reopen anytime soon, produces consistent late-week selling.
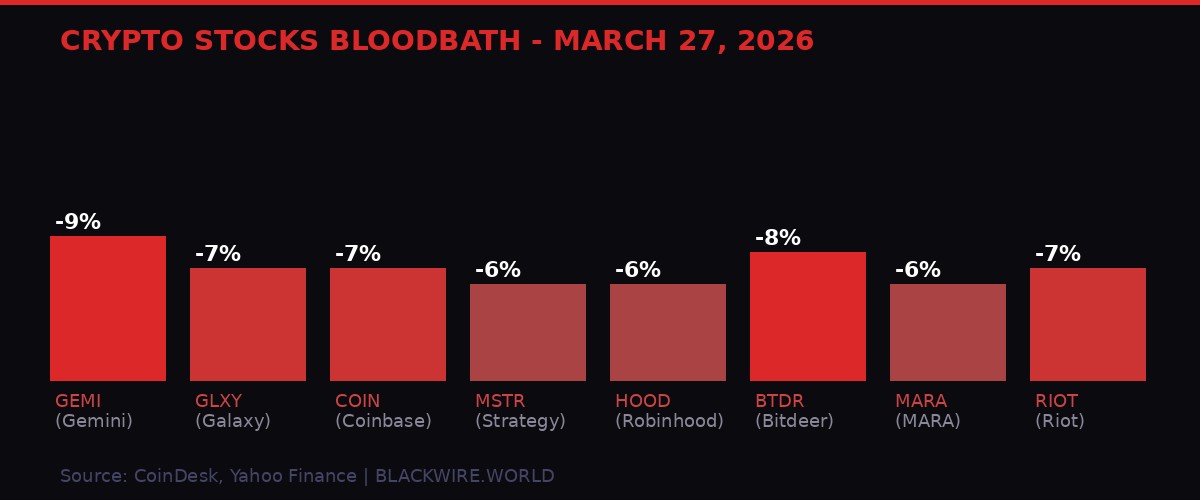
The March 27 session was another Friday execution. Coinbase (COIN) dropped nearly 7%. Galaxy Digital (GLXY) fell 7%. Gemini (GEMI), which went public this year, posted the biggest loss in the group at nearly 9%. Robinhood (HOOD), despite announcing a $1.5 billion stock buyback earlier in the week, slid 6%.
Bitcoin balance sheet plays followed. Strategy (MSTR) and Twenty One Capital (XXI) both fell about 6%. Ethereum treasury names Bitmine Immersion (BMNR) and Sharplink Gaming (SBET) were down around 5%. Miners, which trade as leveraged bets on both bitcoin price and AI infrastructure expectations, got hit from both angles. Riot Platforms (RIOT), CleanSpark (CLSK), IREN, HIVE Digital, and Hut 8 all posted 5-8% losses. Even MARA (MARA) and Bitdeer (BTDR), which had outperformed on Thursday, gave back all their gains and landed at -6% and -8% respectively.
The pattern is systematic. Every company that touched bitcoin in the bull run - through mining, custody, exchange operations, or balance sheet treasury - is now a leveraged short on the macro trade. When oil spikes and Fed cut odds collapse, these stocks get repriced faster and harder than bitcoin itself.
The CoinDesk Computing Select Index (CPUS), which tracks infrastructure-heavy names, dropped 2.3% on Friday versus 1.2% for the bitcoin-heavy CoinDesk 20 (CD20). The leverage embedded in these equity vehicles amplifies every macro shock. Traders who bought crypto stocks as a "regulated" proxy for bitcoin exposure are learning that they bought something more volatile, not less.
$300 Million in Longs Wiped: The Derivatives Massacre

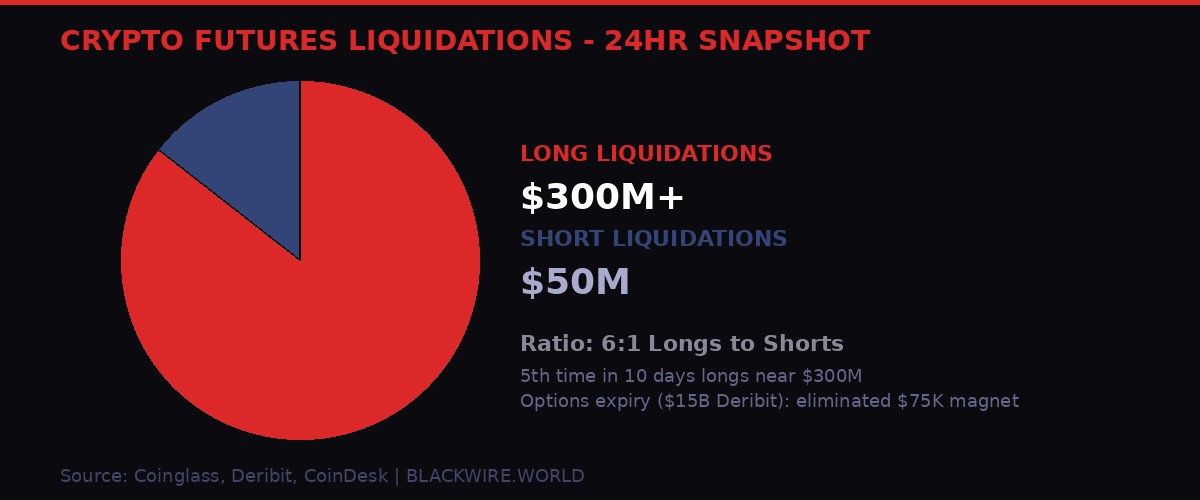
The derivatives data tells the story of a crowded, losing trade. In the 24 hours surrounding the March 27 selloff, nearly $300 million in long crypto futures positions were liquidated. Shorts? About $50 million. That's a 6:1 ratio of bulls to bears getting wiped out.
More telling: this was the fifth time in 10 trading days that long liquidations approached that $300 million level. The same bet - that the Iran war would push bitcoin higher as a haven asset or that geopolitical fear would drive gold-like flows into BTC - has been unwound, rebuilt, and unwound again five times in two weeks.
The Iran war thesis for bitcoin hasn't worked. The "digital gold" narrative, so potent during the 2020-2021 cycle, is failing against a backdrop where liquidity is actually tightening rather than loosening. Haven flows went to... Treasury bonds and actual gold. Bitcoin, classified by institutional desks as a risk asset, sold off with equities.
Friday's session had an additional complication: $15 billion in bitcoin options expired on Deribit earlier in the day. The notional expiry had been holding a $75,000 "price magnet" in place - a gravitational pull toward that strike as dealers hedged their books. With the expiry gone, that anchor was removed. Without the $75K magnet to pull toward, the path of least resistance opened toward lower levels.
On the options market, the fear gauge is persistent but not panicked. Bitcoin's 30-day implied volatility index (BVIV) and Ethereum's equivalent (EVIV) both continued declining despite spot weakness - meaning options traders don't expect an imminent crash, just a grinding bear. Puts trade at a 6-8 volatility point premium to calls across all expirations, showing steady demand for downside protection without outright panic buying.
XRP's open interest rose 2% to 1.95 billion XRP even as the price fell 2.5% - a textbook setup for short building in a falling market. Memecoin SHIB showed the most aggressive derisking signal: the largest negative open-interest-adjusted cumulative volume delta among major tokens. When SHIB goes bearish first, that's usually a floor-sensing signal that's still not done finding its floor.
Bitcoin's Compressed Valuation: Why Bitwise Says the Worst Is Already In
Here is the contrarian read that traders need to sit with: bitcoin may have already taken its punishment while equities are still in the early innings of repricing.
Asset manager Bitwise made this case on Friday through senior research associate Luke Deans. The argument runs like this: bitcoin, as a "highly reflexive and liquidity-sensitive asset," tends to respond earlier to shifts in risk appetite than traditional equities. Crypto began pricing in tighter financial conditions months before stocks peaked in January. The massive drawdown from $126,000 to $66,000 - a 45% decline - happened largely before the Iran conflict, not because of it.
"Bitcoin, a highly reflexive and liquidity-sensitive asset, typically responds earlier to shifts in risk appetite. This suggests that digital assets began reflecting tighter financial conditions ahead of many traditional risk assets. Relative valuation indicators further reinforce this dynamic." - Luke Deans, Senior Research Associate, Bitwise Asset Management
The Mayer Multiple, which compares bitcoin's spot price to its 200-day moving average, has been sitting in the lower historical percentile range since January. That metric, when this low, has historically correlated with periods of reduced downside risk - because the asset has already de-leveraged, shed speculative excess, and repriced toward fair value based on long-run fundamentals.
Equities, by contrast, entered 2026 at elevated valuations. The Magnificent Seven traded at premium multiples built on rate-cut assumptions that have now evaporated. As Deans put it, stocks are only beginning to reprice as macro conditions deteriorate, while bitcoin has been doing that repricing since October.
"Historically, assets that have undergone substantial valuation compression tend to exhibit reduced downside sensitivity as leverage and speculative positioning are progressively unwound. Alternatively, markets trading closer to cyclical highs often retain greater vulnerability to negative macro catalysts." - Luke Deans, Bitwise Asset Management, via CoinDesk
This doesn't mean bitcoin is about to rally. Correlation across all crypto assets has surged, creating what Bitwise describes as a "single-factor environment" driven entirely by BTC's price action. Altcoins can't decouple. Ethereum can't decouple. Everything moves with macro.
The implication: if the macro environment stabilizes - if oil pulls back from $100, if the Fed gets clarity to cut, if the Strait of Hormuz risk premium fades - bitcoin has less further to fall than tech equities do. It's a compressed spring argument. For traders with 6-12 month horizons, the risk-reward profile may look different than the week-to-week carnage suggests.
Morgan Stanley Enters the ETF War With a Price Gun

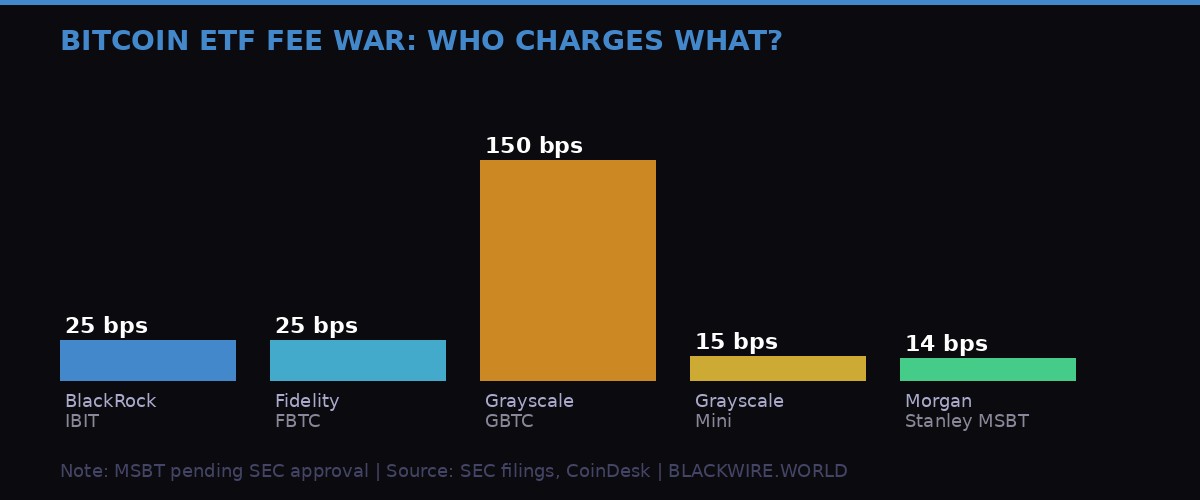
While the market was bleeding Friday, Morgan Stanley filed amended paperwork for its proposed spot bitcoin ETF, the MSBT, pricing it at 14 basis points annually. That's the lowest fee of any bitcoin ETF currently proposed or approved in the U.S. market.
For context: BlackRock's iShares Bitcoin Trust (IBIT), the largest spot bitcoin ETF by AUM, charges 25 basis points. Fidelity's FBTC is also at 25 basis points. Grayscale's flagship GBTC - the original bitcoin trust that converted to an ETF - charges a whopping 150 basis points and has watched assets drain from $29 billion at launch in early 2024 to around $10 billion today. Grayscale's own response to the fee pressure was its Bitcoin Mini Trust, priced at 15 basis points.
Morgan Stanley just undercut the Mini Trust by 1 basis point.
The pricing decision is surgical. Spot bitcoin ETFs are structurally near-identical - each holds bitcoin, tracks its price, and custody through regulated third parties. With no product differentiation, cost becomes the decision variable. A financial advisor managing $100 million in client allocations can shift from IBIT to MSBT with a single trade. Same bitcoin exposure, lower fees. It's an easy sell to compliance and investment committees.
Morgan Stanley's wealth management arm oversees trillions in client assets across one of the largest advisor networks in the U.S. If even 1% of that AUM gets allocated through MSBT, the fund would immediately become one of the largest bitcoin ETFs in existence. The fee race, already accelerated by BlackRock and Fidelity's January 2024 entries, is now entering its next phase.
The New York Stock Exchange has already issued a listing notice for MSBT, signaling readiness. If the SEC approves - and given the current administration's posture toward crypto, approval seems probable - this would mark the first spot bitcoin ETF issued directly by a major U.S. bank. Not an asset manager. Not a crypto-native firm. A bank.
The timing is interesting. Banks are entering the bitcoin ETF space as bitcoin trades 45% below its all-time high and crypto sentiment sits at multi-month lows. Either that's a buy signal or it's institutional actors playing a long-term asset gathering game that doesn't care about short-term price. Given Morgan Stanley's track record, bet on the latter.
Canada Bans Crypto Election Donations: The Global Regulatory Squeeze Tightens

On March 26, Canada's federal government introduced Bill C-25, the Strong and Free Elections Act. Buried inside it: a complete prohibition on cryptocurrency donations to political campaigns. The ban covers registered parties, riding associations, candidates, leadership contestants, and third-party election advertisers.
This follows a near-identical move by the UK government, which announced an "immediate moratorium" on crypto donations to political parties last week. The stated concern in both cases: digital assets can obscure the origin of foreign money flowing into domestic politics.
Here's the irony - Canada has had a crypto donation framework since 2019, and it was barely used. No major federal party publicly accepted crypto donations in either the 2021 or 2025 elections. The Chief Electoral Officer's own reports acknowledged that no contributions were disclosed. The ban is preemptive, targeting a vulnerability that hasn't been exploited, at least not openly.
But the Chief Electoral Officer had been watching the U.S. experience and growing uncomfortable. A 2022 report recommended tightening the rules. By November 2024, the recommendation had shifted from "tighten" to "prohibit outright." The reasoning: cryptocurrency's pseudo-anonymity makes contributor identification "fundamentally difficult," even with public blockchains and the existing requirements for donors over $200 to be named publicly.
Bill C-25 is actually the second try. Its predecessor, Bill C-65, contained the same provisions but died when Parliament was prorogued in January 2025. This version appears to have political momentum behind it.
The enforcement mechanism is sharp: recipients have 30 days to return, destroy, or convert and remit any crypto received in violation. Maximum penalties: twice the value of the offending contribution plus $100,000 for corporations. That's a deterrent that makes ignoring the rule actively painful.
The U.S. stands as the outlier here. The FEC has allowed crypto donations since 2014 and continues to provide guidance on how to properly disclose them. As Canada and the UK converge on prohibition, the question is whether U.S. regulators will eventually face pressure to follow - particularly if a crypto-linked donation scandal surfaces in the current environment.
The broader regulatory trajectory is tightening globally. Between the DOJ's decision to dissolve its crypto crime unit this week (covered in our earlier bureau report), Canada's election donation ban, the UK's moratorium, and simultaneous EU regulatory consolidation under MiCA, the patchwork of crypto rules is slowly resolving into something more coherent - and more restrictive in specific domains.
The Week's Macro Timeline: How We Got Here

What Happens Next: Three Scenarios

The market is essentially pricing three competing scenarios, and the outcome for crypto - and every risk asset - depends on which one resolves first.
Scenario 1: De-escalation. The Strait of Hormuz partially reopens, Iran accepts a ceasefire framework, and oil retreats toward $80. Inflation expectations ease. The Fed gets runway to cut in June or July. Rate-sensitive assets - growth stocks, crypto, long-duration bonds - recover. Bitcoin, which Bitwise argues has already done its repricing, could lead the recovery faster than equities that are still overvalued relative to their new rate environment.
The problem with this scenario: it requires both the U.S. and Iran to want an off-ramp simultaneously. With Iran's nuclear program degraded and the U.S. 82nd Airborne reported to be repositioning in the region (covered by BLACKWIRE's GHOST bureau), there's no obvious diplomatic ladder available. The Hormuz closure has become as much a political statement as a military tactic.
Scenario 2: Stagflation grind. Oil stays above $90, neither side escalates further nor de-escalates. The Fed holds rates through the summer, then faces a decision: cut into 6% CPI and destroy its credibility, or hold and watch unemployment tick up. Every Friday looks like the one we just had. Crypto drifts lower, range-bound, as the liquidity environment stays compressed. This is the scenario prediction markets currently price as most likely - a prolonged, uncomfortable stasis.
Scenario 3: Escalation. Iran strikes back meaningfully at U.S. assets in the Gulf, or a second front opens. Oil tests $120-130. The Fed is paralyzed. Emergency rate cuts to combat a recession collide with energy-driven inflation. This is the 1970s stagflation scenario with a crypto overlay - historically bad for all financial assets short-term, potentially constructive for bitcoin long-term if it successfully competes with gold as a "chaos hedge." But that thesis hasn't worked yet, and the track record of bitcoin behaving like a haven asset in genuine crises remains thin.
Derivatives positioning suggests traders are not pricing the escalation scenario - implied volatility is declining even as spot prices fall. That's either sophisticated or complacent. Given that $15 billion in options just expired and the next major expiry gives traders less near-term hedging structure to anchor around, the next two weeks could see wider price swings than the volatility surface currently implies.
The Morgan Stanley ETF timing is its own signal. Wall Street wealth managers don't file low-fee ETFs at the bottom of a bear market by accident. They're building infrastructure for the next cycle. The question is whether retail and institutional allocators have the stomach to accumulate at $66,000 when the macro environment is as hostile as it is right now.
The Fed trap is real. Too much inflation to cut, too much risk-off pressure to hike without causing a financial accident. Bitcoin and crypto markets sit in the crossfire - not as a cause of the problem, but as the most liquid, most globally accessible risk asset available for rapid de-risking. Until oil comes down or the Fed gets clarity, that pattern isn't changing on a Friday.
Key Data Points - Week of March 24-28, 2026
Get BLACKWIRE reports first.
Breaking news, investigations, and analysis - straight to your phone.
Join @blackwirenews on Telegram