The $2.2 Billion Reckoning: FTX Pays Creditors Tomorrow While Markets Price In Rate Hikes for the First Time

The crypto market braces for $2.2 billion in FTX distributions and a macro regime shift. (Pexels)
Tomorrow morning, $2.2 billion leaves the FTX Recovery Trust and lands in the accounts of creditors who have been waiting since November 2022 to get their money back. At the same time, the CME FedWatch Tool shows a 30% probability that the Federal Reserve will raise interest rates this year - a number that was functionally zero three weeks ago. Bitcoin dipped to $65,112 overnight before recovering to $67,400. Strategy broke its 13-week buying streak. Bitfinex longs hit a 28-month high, which historically means the price is about to go the other way.
This is not one story. It is five converging stories, and every single one of them has implications for where crypto goes in Q2 2026. Here is what you need to know, why it matters, and what the smart money is doing about it.
The FTX Fourth Distribution: $2.2 Billion Hits the Wire
FTX Recovery Trust distribution timeline - four rounds totaling approximately $9.8 billion. (BLACKWIRE/VOLT)
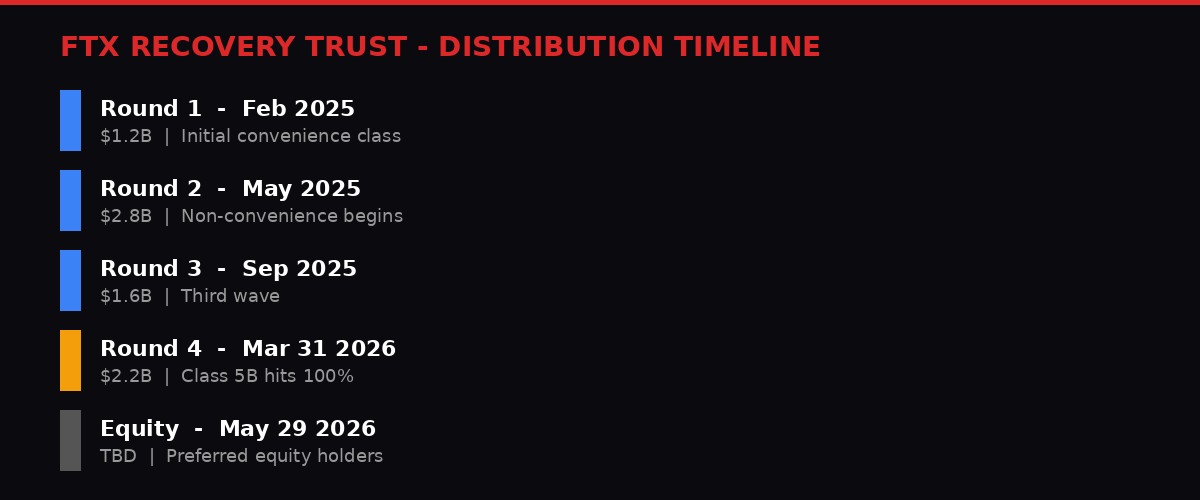
On March 31, 2026, the FTX Recovery Trust will execute its fourth major creditor distribution since the exchange collapsed. The trust announced the $2.2 billion payout on March 18 via a press release, confirming that funds would flow to both "Convenience" and "Non-Convenience" class creditors through BitGo, Kraken, and Payoneer. Funds are expected to arrive within one to three business days.
This is not the first round. The trust has already distributed over $6 billion across three prior waves - $1.2 billion in February 2025, $2.8 billion in May 2025, and $1.6 billion in September 2025. Tomorrow's payout brings the cumulative total to approximately $7.8 billion (per the trust's own filings, though some estimates including the initial convenience class payouts put the broader total higher).
What makes this round significant is the recovery rates. According to the trust's statement, several customer claim classes are now hitting full recovery:
- Class 5A Dotcom receives an additional 18%, bringing total recovery to 96%
- Class 5B (U.S. customers) reaches 100% recovery
- Classes 6A and 6B both hit 100%, each receiving a 15% increment
- Class 7 reaches a cumulative 120% distribution - they are getting more than they lost, at least in dollar terms
That last point is the catch. All distributions are made in U.S. dollars. The trust calculates claims based on the value of assets at the time of the bankruptcy filing in November 2022. Bitcoin was around $16,000 then. It is $67,400 now. A creditor who held 1 BTC at filing is getting paid roughly $16,000 for an asset now worth over four times that. Class 7 getting "120%" means 120% of November 2022 prices - still a massive loss in real terms for anyone who held crypto.
Sam Bankman-Fried continues serving his 25-year sentence. The trust has also set April 30 as the record date for its first distributions to preferred equity holders, with payments scheduled for May 29. Eligible holders must complete ownership certification, KYC verification, and tax documentation to qualify.
FTX BY THE NUMBERS
$2.2B distributing March 31 | $7.8B+ total distributed across 4 rounds | 762,099 BTC held by Strategy (formerly MicroStrategy) | 25 years SBF's prison sentence | 100% recovery for Class 5B U.S. customers (at filing-date prices) | 120% cumulative for Class 7
Where Does the $2.2 Billion Go?
The market question is straightforward: does this money re-enter crypto, or does it stay in fiat? Historical data from prior FTX distributions suggests a mixed picture. The February 2025 round coincided with a modest BTC rally, but correlation is not causation - multiple other factors were in play. The May 2025 round had no discernible market impact. The September 2025 distribution arrived during a broader selloff driven by macro conditions.
Creditors receiving payouts through BitGo and Kraken have the option to convert directly into digital assets. Kraken specifically offers seamless fiat-to-crypto conversion. But the key variable is whether creditors who were burned by FTX have any appetite to re-enter the market at all. Sentiment surveys from bankruptcy forums suggest a roughly even split: about half intend to buy back into crypto, while the other half plan to take the cash and never look back.
$2.2 billion is meaningful but not market-moving in a global crypto market with a $2.3 trillion total capitalization. The real impact is psychological. FTX payouts are a reminder of the worst period in crypto's history, and they land at the worst possible macro moment.
The Rate Hike Nobody Saw Coming
CME FedWatch shows a 180-degree reversal in rate expectations in under four weeks. (BLACKWIRE/VOLT)
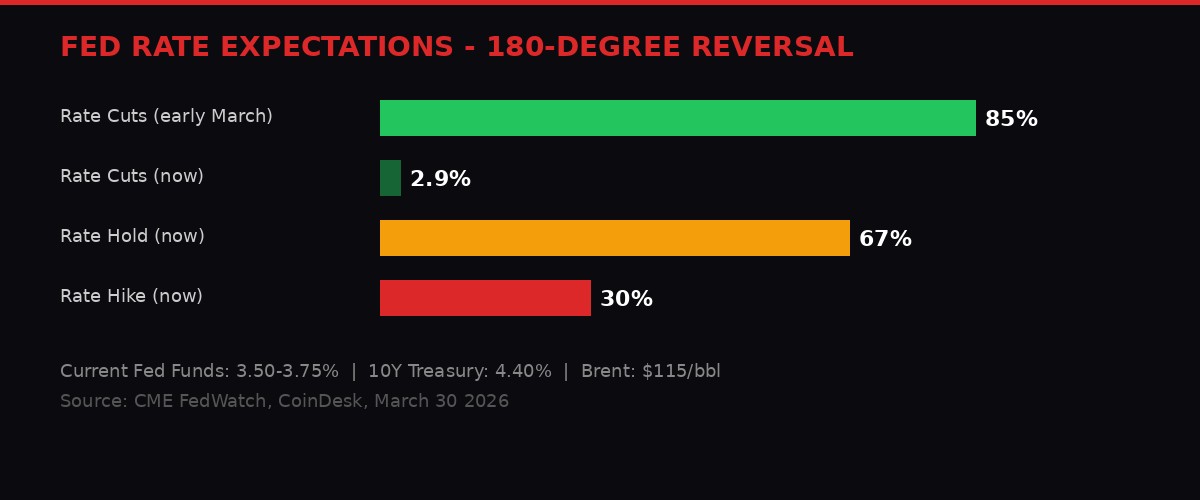
Three weeks ago, markets were pricing in multiple Federal Reserve rate cuts for 2026. The consensus was clear: inflation was trending down, the economy was softening, and the Fed would begin easing by mid-year. That consensus has been obliterated.
Current pricing on the CME FedWatch Tool shows a nearly 30% probability that the fed funds rate will be higher by year-end than its current level of 3.50%-3.75%. The odds of rates going lower have crashed to 2.9%. This is a 180-degree reversal that has happened in less than a month.
The driver is oil. Since the escalation of the Iran war at the end of February, Brent crude has surged from approximately $70 per barrel to $115. That is a 64% increase in roughly five weeks. Oil at $115 feeds directly into consumer prices - gasoline, heating, transportation, manufacturing inputs, food production. Even before oil's surge, core inflation in February came in at 2.5% year-over-year, still well above the Fed's 2% target. Core inflation has not dropped below 2% since April 2021.
The 10-year Treasury yield has climbed to 4.40% from below 4% just weeks ago. Longer-term inflation expectations remain sticky - 5-year breakevens at 2.5%, 10-year at 2.3%. These numbers tell the bond market that inflation is not transitory. It is structural, and it is getting worse.
"Food and energy prices are tragically going to climb and remain high for a while, at least until the utter mess of Middle East shipping is sorted out. Even if a peace deal were to be agreed tomorrow (unlikely), that would take months at best." - Crypto is Macro Now Newsletter
The macro backdrop has shifted from "when does the Fed cut" to "does the Fed actually hike." For crypto, this is devastating. Bitcoin's entire 2023-2024 bull thesis was built on rate cut expectations and liquidity expansion. Rate hikes - or even the expectation of rate hikes - compress risk asset valuations and drain the speculative capital that flows into crypto during easing cycles.
There is a counterargument. The U.S. is a net energy exporter, so higher oil prices boost GDP through that channel. Military spending will increase to replenish hardware depleted in the Iran war, adding fiscal stimulus. Both factors could prevent a sharp GDP decline even as consumer prices rise. But this is the textbook definition of stagflation - rising prices with stagnant or weakening growth - and stagflation is the worst possible macro environment for risk assets.
Bitcoin's War Range: The Floor Just Cracked
Five weeks of war, and the pattern of higher lows just broke. (BLACKWIRE/VOLT)
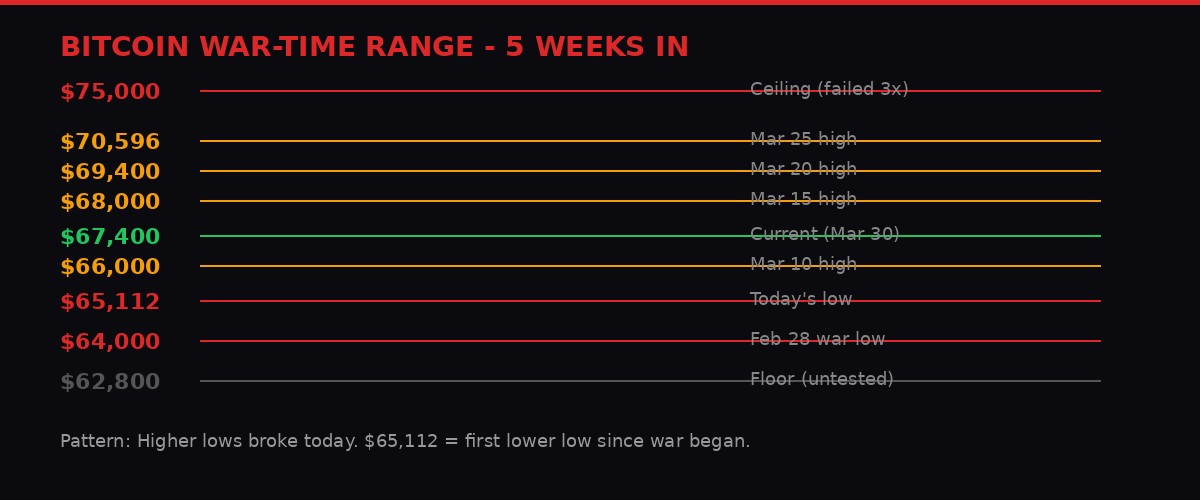
Bitcoin fell to $65,112 early Monday morning, its lowest level since the February 28 crash that kicked off the Iran war. The recovery to $67,400 was quick - Asian session buyers showed up near $65,000 - but the damage to the technical structure is real.
For five weeks, Bitcoin had been building a pattern of higher lows on each escalation. The February 28 war low was $64,000. Then $66,000. Then $68,000. Then $69,400. Then $70,596. Each time the war escalated, Bitcoin dipped less. That was the bullish case: Bitcoin was absorbing geopolitical shocks and finding resilient demand at progressively higher levels.
Monday's dip to $65,112 broke that pattern. It is the first time in five weeks that the floor moved lower rather than higher. Whether this is a one-day aberration or the start of a breakdown below the $62,800-$75,000 range is the defining question for April.
The escalation that triggered the move came from multiple directions. Iran-backed Houthi forces entered the conflict, opening a front beyond the direct U.S.-Israel-Iran theater. Additional U.S. troops arrived in the Middle East. The Wall Street Journal reported that President Trump is weighing a military operation to remove enriched uranium from Iran, though no decision has been made. And Iran attacked two aluminum production sites, sending the metal up 6% and extending the war's economic damage beyond oil into industrial commodities.
Ethereum recovered 2% to $2,044. Solana gained 0.9% to $83.48. XRP added 1.4% to $1.35. The 24-hour green across the board masks a rough weekly picture: BTC down 1%, ETH down 0.9%, XRP down 1.9%, SOL down 3.7%. Tron is the outlier, up 2.6% daily and 4.6% weekly, quietly outperforming the entire majors complex for reasons nobody can convincingly explain.
The Derivatives Story Is Bearish
Growth in Bitcoin futures open interest stalled after hitting a near two-month high of 748.65 BTC on Saturday. Perpetual funding rates are near zero. The 24-hour cumulative volume delta (CVD) is negative, suggesting a bias toward short positions. Most critically, open interest declined during the spot price bounce from the $65,000 low. That means the rally is spot-driven and has not attracted leveraged buyers. In derivatives language: this bounce does not have conviction.
AVAX and LTC show double-digit percentage gains in futures open interest, signaling capital inflows. But most of those inflows appear tied to bearish bets, as indicated by their negative CVDs. Money is coming in, but it is betting down.
Bitcoin's 30-day implied volatility index has compressed to 55%, down from 58% over the weekend. This is remarkable given the geopolitical chaos. The reason, according to Tesseract CEO James Harris, is that institutional participants have been systematically selling call options to generate yield, transferring gamma exposure to dealers who then buy dips and sell rallies to stay delta-neutral. The result is mechanical volatility suppression - the market looks calm because the plumbing is forcing it to look calm, not because conditions are calm.
DERIVATIVES SNAPSHOT
BTC OI: 748.65 BTC (stalled) | Funding: Near zero | CVD: Negative | BVIV: 55% (compressed) | Deribit: Puts cost more than calls across all timeframes | Dealer gamma: Negative between $65K-$70K
Strategy Breaks the Streak: No Bitcoin Purchase for the First Time in 13 Weeks

Michael Saylor's 13-week buying streak is over. Strategy holds 762,099 BTC. (Pexels)
Strategy (MSTR), the largest publicly traded holder of Bitcoin, did not purchase any BTC last week. This breaks a streak of 13 consecutive weekly buys that began in late December 2025, during which the company acquired 90,831 BTC.
Executive Chairman Michael Saylor's Sunday ritual is well-known to crypto traders: post the "Orange Dot" on X to signal an upcoming purchase, followed by a detailed update around 8 AM ET Monday. This Sunday, there was no Orange Dot. Instead, Saylor posted about the company's perpetual preferred equity offering, Stretch (STRC). The silence was deafening.
Strategy currently holds 762,099 Bitcoin at an average acquisition price of $75,694 per token. At current prices around $67,400, the company is underwater on its entire average position. MSTR stock trades approximately 77% below its November 2024 all-time high.
The pause raises several questions. Is this a temporary cash flow issue related to the preferred equity offering? Is Strategy running low on available capital for purchases? Or is this a signal that even the most committed Bitcoin buyer in public markets sees risk in adding to a losing position during a macro deterioration?
Strategy has funded its Bitcoin purchases through a combination of debt issuance, equity sales, and preferred stock offerings. The company's $42 billion "21/21 Plan" - $21 billion in equity and $21 billion in fixed income over three years - is still in progress. But executing that plan requires willing buyers of Strategy's paper, and the appetite for MSTR equity at 77% below its peak is not what it was when Bitcoin was above $100,000.
The timing matters. Strategy pausing at the same moment FTX distributions create potential sell pressure, rate hike expectations spike, and Bitcoin's technical floor cracks is not a coincidence. The company that has been the single largest source of consistent Bitcoin demand just stepped off the field.
The Bitfinex Contrary Indicator: 79,343 Longs Say Sell
BTC/USD longs on Bitfinex have historically been a textbook contrary indicator. (BLACKWIRE/VOLT)
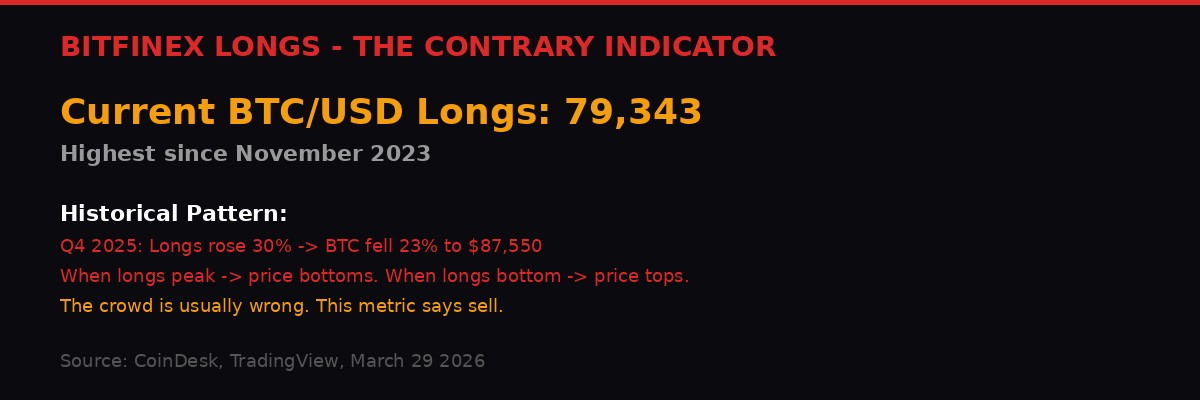
The number of BTC/USD long positions on Bitfinex has climbed to 79,343, the highest level since November 2023. On the surface, rising bullish bets should signal growing upside pressure. In practice, Bitfinex longs have been one of the most reliable contrary indicators in crypto for years.
The pattern is consistent. In Q4 2025, Bitfinex longs rose 30% while BTC's spot price tanked 23% to $87,550. Price bottoms tend to coincide with long peaks, and rallies begin when longs decline. Price tops hit when longs are at their lowest, then prices slide as longs climb. The crowd, as veteran traders put it, is usually wrong.
The current reading of 79,343 combined with Bitcoin at $67,400 suggests the market has more downside risk than the leveraged bulls believe. This does not mean a crash is guaranteed - past performance is not predictive, and every contrary indicator eventually stops working. But the weight of historical evidence points toward caution.
What makes this signal particularly relevant right now is the context. Bitfinex longs are peaking alongside: rate hike pricing at 30%, Strategy pausing purchases, Bitcoin's higher-low pattern breaking, oil at $115, and the Iran war expanding into new fronts. Every single one of these factors independently suggests bearish pressure. Together, they form a confluence that the Bitfinex long crowd appears to be ignoring.
The Covered Call Trap
There is a structural explanation for why Bitcoin's volatility remains suppressed despite all of this chaos. According to James Harris, CEO of MiCA-licensed digital asset manager Tesseract, institutional participants have spent Q1 2026 systematically selling call options against their BTC holdings to generate yield in a down-to-sideways market.
This "covered call" strategy transfers gamma exposure to dealers - the market makers who take the other side of these options trades. Dealers with positive gamma are forced to buy Bitcoin as it falls and sell as it rises to maintain delta neutrality. The mechanical result is range-bound price action. Bitcoin is not volatile because the options market plumbing is actively suppressing volatility.
"The effect has been a mechanical suppression of realised volatility - the DVOL index has compressed by roughly six points this week despite the macro backdrop." - James Harris, Tesseract CEO
This has a shelf life. Gamma suppression works until a shock is large enough to overwhelm the hedging flows. If Bitcoin breaks below $62,800 or above $75,000 with real conviction, the gamma unwind could amplify the move dramatically. Range compression often precedes the biggest breakouts - or breakdowns.
The Week Ahead: FTX, Jobs, and the Iran Escalation
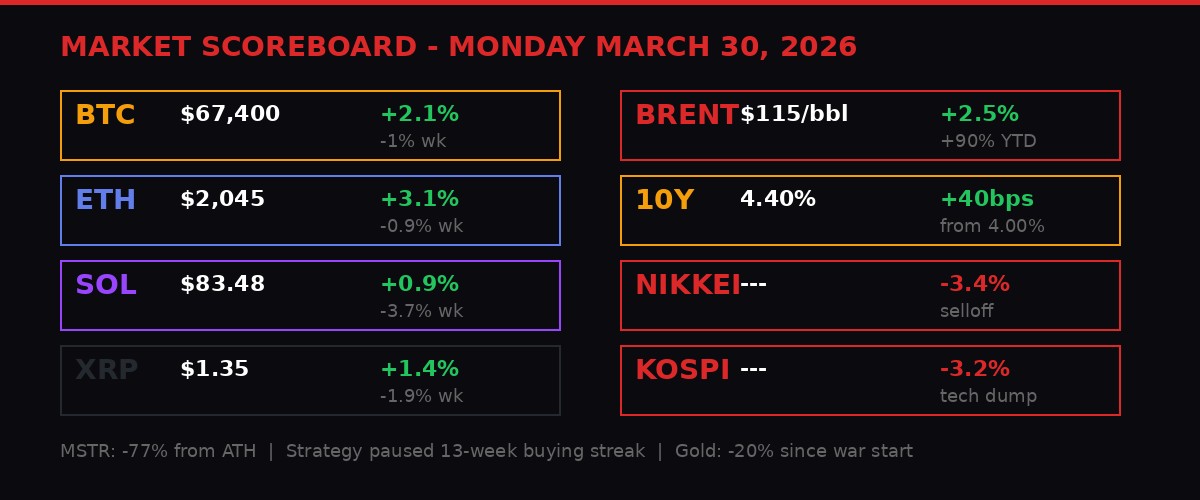
Full market scoreboard as of March 30, 2026. (BLACKWIRE/VOLT)
This is not a normal week. The calendar is stacked with potential catalysts, and every single one of them has the capacity to move markets.
Monday March 30
- BNP Paribas introduces six cryptocurrency exchange-traded notes
- China NBS Manufacturing PMI for March (previous: 49.0)
- China Non-Manufacturing PMI (previous: 49.5)
- Pakistan hosts Saudi, Turkish, Egyptian diplomats for Iran peace talks
Tuesday March 31
- FTX Recovery Trust distributes $2.2 billion to creditors
- Eurozone Inflation Rate YoY Flash for March (previous: 1.9%)
- U.S. S&P/Case-Shiller Home Price Index YoY for January
- U.S. Chicago PMI for March (previous: 57.7)
- U.S. Consumer Confidence for March (previous: 91.2)
- U.S. JOLTS job openings for February (previous: 6.946M)
- Japan Tankan Large Manufacturing Index for Q1
Wednesday April 1
- BGD Labs officially leaves the Aave DAO
- U.S. ADP Employment Change for March (previous: 63K)
- U.S. ISM Manufacturing PMI for March (previous: 52.4)
Thursday April 2
- U.S. Initial Jobless Claims (previous: 210K)
Friday April 3 (Good Friday - Many Markets Closed)
- U.S. Nonfarm Payrolls for March (estimate: 48K, previous: -92K)
- U.S. Unemployment Rate (estimate: 4.5%, previous: 4.4%)
- U.S. ISM Services PMI for March (previous: 56.1)
- Nevada vs Kalshi hearing on temporary restraining order extension
The nonfarm payrolls report is critical. February's print of -92K was catastrophic - the first negative payrolls reading since the pandemic. The March estimate of 48K is barely above zero. If March comes in negative again, the stagflation narrative goes from theoretical to consensus. If it surprises to the upside, the rate hike pricing eases. Either way, the number moves markets.
Good Friday closures mean equity traders will be watching the payrolls number without the ability to react immediately in stock markets. Crypto, which trades 24/7, becomes the de facto outlet for risk positioning around the jobs data. Expect heightened volatility in BTC and ETH on Friday regardless of the number.
The Ethereum Foundation Doubles Down: $42 Million Staked

The Ethereum Foundation staked 20,470 ETH in a single batch - one of its largest visible deposits. (Pexels)
While the macro picture deteriorates, the Ethereum Foundation is making a statement about long-term conviction. On Monday, approximately 20,470 ETH - roughly $42 million at current prices - flowed from Ethereum Foundation-linked wallets into the Beacon Chain staking contract. Arkham Intelligence flagged the deposits, which were split into uniform chunks of roughly 2,047 ETH each.
This is the largest single-day staking batch the Foundation has executed, extending a strategy first outlined in February 2026 when the Foundation announced it would stake 70,000 ETH to generate yield for operational funding. The logic is straightforward: rather than selling ETH to fund operations, research, ecosystem development, and grants, the Foundation earns staking rewards. At current rates via the CoinDesk Composite Ether Staking Rate (CESR), that yield is 2.7% - down from 3.4% earlier this year.
The Foundation still holds approximately 147,400 ETH ($303 million) in its treasury, according to Arkham onchain data. The staking move is strategically sound: it generates income without reducing the Foundation's ETH exposure, and it signals confidence in Ethereum's proof-of-stake security model to the broader ecosystem.
But there is a tension. The Foundation staking 70,000+ ETH at sub-3% yields while Ethereum underperforms Bitcoin, Solana, and even Tron on most timeframes raises questions about opportunity cost. ETH is down 0.9% on the week and trades at $2,045 - well below its October 2025 highs. The staking yield does not compensate for price depreciation. The Foundation is essentially locking up capital in an asset that has been bleeding value against every major benchmark except BTC in the short term.
For validators and stakers watching the Foundation's moves, the 2.7% yield environment is notable. Staking rewards have been declining as more ETH enters the staking pool, diluting per-validator returns. The Foundation's massive deposits will push yields even lower, marginally. This creates a paradox: the Foundation's staking is good for network security but bad for staking economics.
The Prediction Market Siege: Kalshi Under Fire From Multiple States

Washington, Nevada, and more states are closing in on prediction markets. (Pexels)
Washington State sued Kalshi on Friday, alleging the prediction market platform offers "gambling products" disguised as derivatives contracts. The lawsuit adds to growing legal pressure from states that see platforms like Kalshi and Polymarket as unregulated online gambling operations.
Washington's complaint argues that Kalshi's products meet state definitions of "gambling," "professional gambling," and "bookmaking." The lawsuit specifically alleges that Kalshi promotes gambling addiction and targets college students. Kalshi has filed to move the case to federal court, arguing that as a CFTC-regulated exchange, it falls under exclusive federal jurisdiction.
The lawsuit came one week after Nevada won an appeals court victory allowing it to temporarily ban Kalshi's sports, entertainment, and election contracts in the state. That ban is set for a hearing on April 3, where a Nevada judge will decide whether to extend it. Despite the ban, Gambling Insider reported that Nevada users were still able to access Kalshi's platform.
The jurisdictional fight - federal regulation of derivatives versus state regulation of gambling - is heading toward the Supreme Court. CFTC Chair Mike Selig argues that prediction markets are legitimate derivatives subject to federal oversight. States counter that calling a bet a "prediction contract" does not change its fundamental nature as gambling.
Meanwhile, on the other side of this debate, a Polymarket trader named LlamaEnjoyer (known as Verrissimus on X) turned $676 into $67,000 in under a minute on Sunday. During a UFC heavyweight bout, cage announcer Bruce Buffer initially named the wrong winner. Polymarket shares for the incorrect winner spiked to 99 cents. LlamaEnjoyer, sensing something was wrong, bought Fortune shares at 1 cent instead. When the UFC corrected the announcement seconds later, those shares immediately resolved at $1.
"I almost bought Tybura at 99 cents with $100k. Stopped, realized something was off. Cancelled my order, scooped up 1 cent shares instead. The UFC corrected the winner seconds later. Easiest 100x ever." - Verrissimus on X
The episode highlights both the potential and the danger of prediction markets. A single human error by a ring announcer created a 100x trading opportunity for the fastest player in the room. It also raises real questions about how platforms should handle payouts when the "source of truth" - in this case, the official UFC announcement - makes a mistake. These are exactly the kinds of edge cases that regulators cite when arguing for tighter oversight.
Where This All Converges

Five converging forces. One market. No clear exits. (Pexels)
Zoom out. The crypto market enters the last week of Q1 2026 facing a convergence of headwinds that have not existed simultaneously before:
- $2.2 billion in FTX creditor payouts creating potential sell pressure and a psychological reminder of crypto's worst failure
- Rate hike expectations at 30% - the first time markets have priced in tightening since the current easing cycle began
- Bitcoin's higher-low pattern breaking after five weeks of holding the war-time range
- Strategy pausing purchases after 13 consecutive weeks, removing the market's most reliable buyer
- Bitfinex longs at 28-month highs - a contrary indicator that has reliably preceded sell-offs
On the other side of the ledger, there are supports. The Ethereum Foundation is staking aggressively. BNP Paribas just launched six crypto ETNs. Altcoins like CHZ, FET, and OP are bouncing from oversold conditions. The CoinDesk Memecoin Index and DeFi Select Index led Monday's recovery. And Pakistan's hosting of Iran peace talks, while unlikely to produce results quickly, at least introduces the possibility of de-escalation.
But the weight of evidence tilts bearish. The macro environment is the worst it has been for crypto in over a year. Oil at $115 with the Iran war entering its fifth week and expanding to new fronts means energy-driven inflation is not going away soon. The covered call trap is suppressing volatility until it breaks - and when gamma unwinds, the move is amplified in the direction of the break.
The nonfarm payrolls report on Friday is the week's binary event. Another negative print cements the stagflation trade. A positive surprise gives the Fed room and crypto a brief reprieve. Either way, the data lands on Good Friday when equity markets are closed, funneling all the reactive flow into crypto and FX.
Bitcoin's Q1 performance tells the story. It has been range-bound between roughly $62,800 and $75,000 for over six weeks. It has underperformed gold on every timeframe except the ultra-short. It has underperformed the Nasdaq and S&P 500 on anything beyond a one-month window. The "digital gold" narrative has been tested and found wanting - real gold dropped 20% since the war started, but it had already doubled in the prior year. Bitcoin, coming into the war already 50% below its October 2025 high, had less to give.
The next breakout or breakdown defines Q2. The range cannot hold forever. And with rate hikes now on the table, the biggest buyer sidelined, FTX money flooding in, and the war expanding - the path of least resistance is lower. Not guaranteed. But probable.
Watch $62,800. If that goes, the next stop is $58,000 and every technical model built on the post-halving cycle breaks. Watch $75,000 to the upside. If Bitcoin reclaims that with volume, the bear case dies fast. Everything in between is noise.
The $2.2 billion hits the wire tomorrow morning. The reckoning is here.
Get BLACKWIRE reports first.
Breaking news, investigations, and analysis - straight to your phone.
Join @blackwirenews on Telegram