
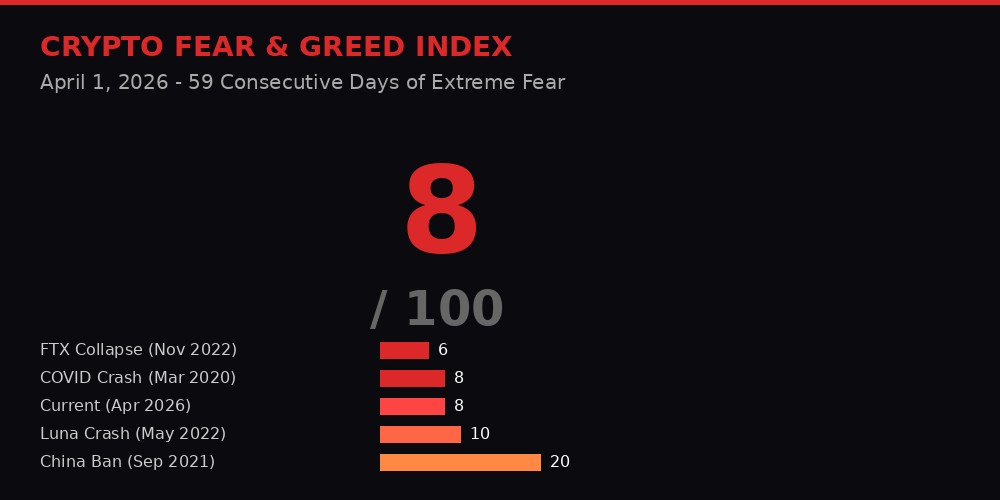
Bitcoin closed Q1 2026 at $67,800. Down 22% in three months. The worst first quarter since 2018. The Crypto Fear & Greed Index is sitting at 8 out of 100 - a number so low it shares company with the FTX collapse and the COVID crash. Fifty-nine consecutive days of extreme fear. Retail traders are liquidating. Crypto Twitter is posting funeral memes. The sentiment reads like a eulogy.
But here is what the panic is hiding: behind the bloodred candlesticks, behind the Fear Index readings that would make a venture capitalist faint, the biggest institutional infrastructure buildout in crypto history is happening right now. Whale wallets accumulated 270,000 BTC in March alone - the largest monthly accumulation event in 13 years. Citadel-backed EDX Markets just filed for a national trust bank charter with the OCC. Australia passed its first comprehensive crypto licensing law. Meta is testing stablecoin payments across three billion monthly active users. Fidelity published research arguing that the opportunity cost of zero bitcoin allocation now exceeds the risk of holding it.
The rails are being built. Not by retail. Not by degens. By the firms that will own the next decade of finance.
This is the story of what happens when fear reaches its mathematical floor and institutions start writing checks.

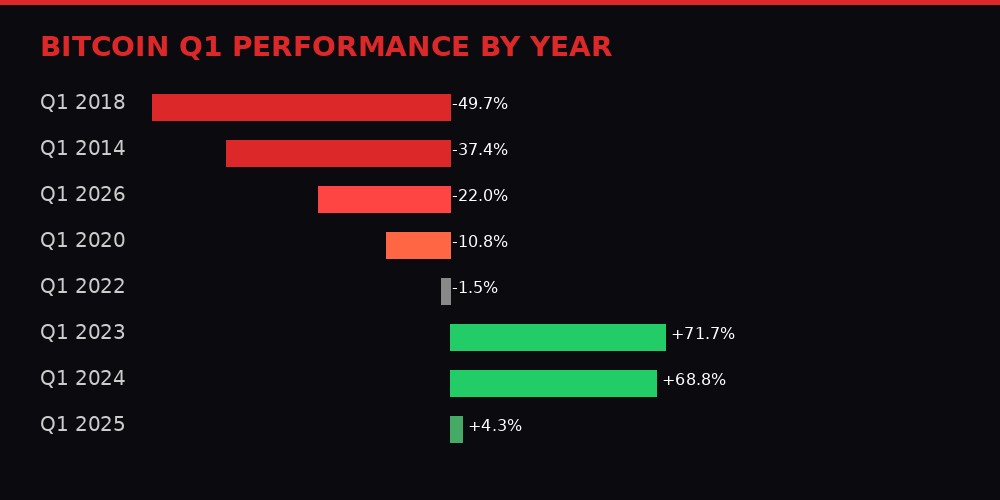
Let the data speak first. Bitcoin opened January 2026 at $87,508. It closed March 31 at $67,800. That is a $19,708 per-coin decline, a 22.5% drawdown, and the worst Q1 performance since 2018's -49.7% cratering during the ICO bubble unwind. Ethereum fared worse: -32.8% for the quarter, landing at $2,070 after touching a cycle low near $1,900 in mid-March during the Iran-related risk-off event that sent global equities into a brief tailspin.
Total crypto market capitalization sits at $2.42 trillion, according to CoinGecko data, down from a cycle high above $3.15 trillion hit during the October 2025 euphoria that followed the spot Bitcoin ETF-driven rally. BTC dominance has climbed to 56.3% - the highest reading since April 2021 - as capital flees altcoins for the relative safety of the largest asset by market cap.
The derivatives market tells its own version of the story. Perpetual funding rates on Binance are firmly negative across every major asset: BTC at -0.0028%, ETH at -0.0010%, SOL at -0.0138%. Negative funding means short sellers are paying a premium to hold their positions - a textbook signal of dominant bearish positioning. Total 24-hour liquidations reached $98.3 million on April 1, with long positions accounting for 66.4% of the carnage. The people trying to buy the dip have been getting systematically destroyed.
Cross-exchange price premiums turned negative across Asian markets, dropping to approximately -0.23% for BTC and -0.24% for ETH, according to Kaiko data compiled in late March. Clara Wu, Research Head at Kaiko, told reporters that negative premiums represent "capitulation-phase selling" where local sellers accept prices below global benchmarks. The last time these spreads remained negative this long was during the FTX-driven sell-off in November 2022 - weeks before BTC printed its cycle bottom at $15,500.
BTC Price: $68,199 (+2.15% on April 1) | Q1 Return: -22.0%
ETH Price: $2,096 (+3.19% on April 1) | Q1 Return: -32.8%
Total Market Cap: $2.42T (down from $3.15T cycle high)
BTC Dominance: 56.3% (highest since April 2021)
Fear & Greed Index: 8/100 (59 consecutive days of Extreme Fear)
24h Liquidations: $98.3M (66.4% long / 33.6% short)
Sources: CoinGlass, Binance, Alternative.me, SoSoValue
Bitcoin has now underperformed U.S. equities for six consecutive months - October 2025 through March 2026. That has never happened before in Bitcoin's 17-year history. The BTC/S&P 500 ratio has trended lower throughout 2026, suggesting Bitcoin is trading as a higher-risk asset relative to standard benchmarks rather than the macro hedge many institutions bought it as. From its all-time high of $126,200 set in October 2025, BTC has retreated approximately 46%.
Every number screams pain. The Fear & Greed Index at 8. Six months of equity underperformance. A quarter that only 2018 can beat for destruction. Retail is running.
But retail is not the market anymore.

While the Fear & Greed Index was printing single digits, something else was happening on-chain that most market commentary has either ignored or buried in paragraph fifteen. Whale wallets - addresses holding 1,000 BTC or more - accumulated approximately 270,000 BTC over the 30-day period ending April 1, according to Coinglass data cited by multiple on-chain analysts. That is the largest monthly accumulation event in 13 years. At current prices, it represents roughly $18.4 billion in bitcoin moving from exchanges to long-term storage.
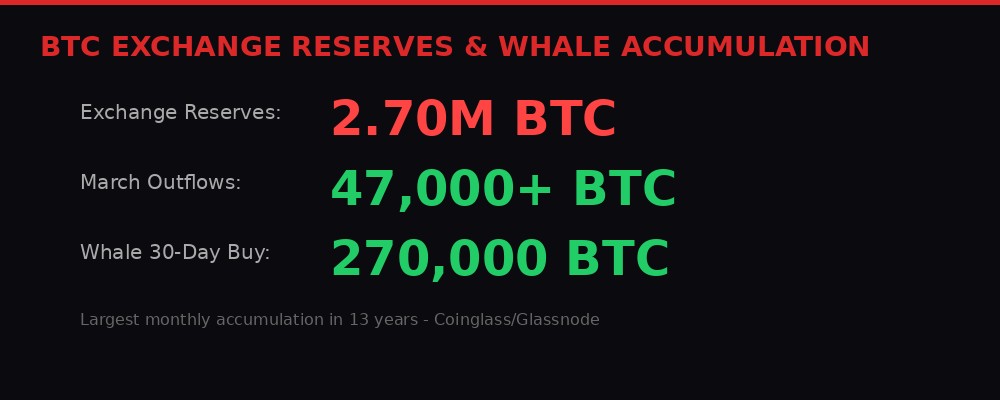
Exchange reserves fell to 2.70 million BTC, continuing a structural decline that has been underway since mid-2024. Over 47,000 BTC exited centralized exchanges in March alone, according to a Bitfinex-cited analysis tracked by The CC Press, reinforcing what on-chain analysts call a "supply squeeze" dynamic. When bitcoin leaves exchanges, it typically moves to cold storage - hardware wallets, custodial vaults, and institutional treasury accounts. It becomes illiquid. It stops being available for sale.
The paradox is striking: whale transaction volumes above $100,000 have plummeted to 6,417 per day - the lowest since September 2023, according to NewsBTC data. Fewer transactions, but vastly larger individual moves. The whales are not trading. They are accumulating. The difference matters enormously for market structure. High-frequency whale trading creates volatility. Slow, persistent accumulation creates supply scarcity.
James Check, lead on-chain analyst at Glassnode, provided context for how to read these signals in combination: "The Fear & Greed Index is most valuable not as a standalone signal, but as a confirmation layer. When extreme fear aligns with oversold technicals and strong on-chain accumulation, the asymmetric upside potential increases substantially."
History supports the pattern. During the FTX collapse, the Fear & Greed Index spent over 60 days below 15. BTC bottomed at $15,500 before rallying 96% over the following six months. During the COVID crash of March 2020, the index hit 8 - exactly where it sits today - before Bitcoin surged 133% in the subsequent half-year as the Federal Reserve unleashed unprecedented quantitative easing. Readings below 15 have preceded positive 30-day returns approximately 78% of the time, according to CoinGlass historical data.
But there is a critical caveat: the FTX bottom came only after an additional 30% drawdown from the initial fear spike. Fear at 8 does not mean the bottom is in. It means the conditions for a bottom are forming. The whales know the difference. That is why they are buying now, not waiting for confirmation.

On April 1, EDX Markets filed an application with the Office of the Comptroller of the Currency for a national trust bank charter. This is not a token launch. This is not a meme coin. This is a crypto exchange backed by Citadel Securities, Fidelity Investments, and Charles Schwab seeking the legal authority to custody assets, settle trades, and offer principal trading services under a federal banking framework.
The filing, first reported by Bloomberg and confirmed by CoinDesk, would allow EDX to serve institutional clients who require regulated custody and settlement infrastructure - pension funds, sovereign wealth vehicles, endowments, and family offices that cannot touch crypto without a federally chartered custodian. If approved by the OCC, EDX would join a small but growing list of crypto-native firms operating under traditional banking charters, alongside Anchorage Digital (which received a conditional federal charter in 2021) and Paxos.
The timing is deliberate. EDX launched in 2023 as a non-custodial exchange - a matching engine that connected institutional buyers and sellers without holding their assets. The trust charter application signals a strategic pivot: EDX wants to vertically integrate, offering execution, custody, and settlement in a single regulated stack. For institutions, that eliminates counterparty risk across multiple vendors and reduces the operational complexity that has kept many large allocators on the sidelines.
A spokesperson for EDX Markets said obtaining a trust charter would position the firm to serve institutional clients that require "regulated custody and settlement systems." That language is precise. Regulated custody is the single biggest bottleneck preventing pension funds and insurance companies from allocating to crypto. The SEC's Staff Accounting Bulletin 121 (SAB 121), which required banks to hold crypto assets on their balance sheets, was effectively neutralized after the banking industry pushed back in late 2025. The regulatory path for institutional custody has been clearing for months. EDX is moving to capture it.
Crypto Briefing reported that EDX is the latest in a sequence of crypto firms pushing deeper into banking. Circle filed for an IPO in early 2026. BitGo expanded its trust company operations. Coinbase has been lobbying for a federal charter for years. The trajectory is not subtle: the companies that survive the bear market are not the ones with the best marketing. They are the ones building regulated infrastructure while everyone else is scared.

On the same day EDX filed its charter, the Australian Parliament passed the Corporations Amendment (Digital Assets Framework) Bill 2025, creating the country's first comprehensive regulatory framework for cryptocurrency. The bill cleared both houses on April 1 and requires crypto exchanges and custody providers to obtain Australian Financial Services Licenses from ASIC - the same license regime that governs brokers, fund managers, and financial advisors.
The law creates two new regulated categories under Australia's Corporations Act: digital asset platforms (which hold crypto on behalf of users) and tokenized custody platforms (which hold real-world assets and issue corresponding digital tokens). Operators of both categories must meet requirements including client asset safeguarding, standardized disclosures, anti-misleading conduct rules, and mandatory dispute resolution and compensation systems.
The legislation is architecturally significant. Rather than regulating cryptocurrency itself - an approach that has caused regulatory confusion in the United States, where the SEC and CFTC have spent years arguing over jurisdiction - Australia chose to regulate the intermediaries. The companies in the middle. The ones that hold customer funds. This targets the exact failure mode that caused the FTX collapse, the Celsius bankruptcy, and the Voyager Digital implosion: commingling of customer assets, opaque operations, and zero regulatory oversight of custody practices.
Research from the Digital Finance Cooperative Research Center and industry groups estimates that Australia could generate as much as A$24 billion annually (approximately US$15.4 billion) from tokenized markets, payments, and digital asset services - roughly 1% of GDP. Under the previous regulatory path, the country was on track to capture just A$1 billion of that potential by 2030. The gap between A$1 billion and A$24 billion is the gap between regulatory inaction and regulatory clarity.
Kate Cooper, CEO of OKX Australia and co-chair of the Digital Economy Council of Australia, called the bill "a pivotal moment," saying it establishes a foundation for "institutional participation and long-term capital allocation." A Kraken spokesperson added that the law provides a "top-down signal" that Australia is serious about digital assets, giving firms confidence to invest and expand locally.
The global picture is forming: Australia has now joined the EU (under MiCA), Singapore, Japan, and the UAE in establishing clear licensing frameworks for crypto firms. The United States, despite spot Bitcoin ETF approval and growing bipartisan support for market structure legislation, still lacks a comprehensive federal framework. Lawmakers are reportedly close to a bipartisan deal on crypto market structure, but time is running out - and the April FOMC meeting on April 29 could inject new uncertainty if Chair Powell signals any hawkish shift on rates.

The company that tried to launch Libra in 2019, got regulatory-bombed into oblivion, rebranded it to Diem, watched that die too, and sold the remnants to Silvergate Bank (which subsequently collapsed) is back. Meta Platforms is testing stablecoin payments across its platforms, with a planned rollout targeting the second half of 2026, according to reports from Cointelegraph and Vanguard Nigeria.
The approach is fundamentally different this time. Instead of issuing its own stablecoin - the move that triggered a global regulatory firestorm and Congressional hearings in 2019 - Meta is choosing partners over power. The company plans to integrate existing dollar-linked stablecoins (likely USDC, given Circle's regulatory positioning and recent IPO filing) into payment flows across Facebook, Instagram, and WhatsApp. Combined, those platforms serve approximately 3.2 billion monthly active users.
The implications for crypto adoption are difficult to overstate. WhatsApp already processes payments in India and Brazil. Instagram has been testing creator payment features. If Meta successfully integrates stablecoin rails into these existing payment flows, it would create the largest fiat-to-crypto onramp in history - not through exchanges, not through ETFs, but through social media apps that people already use every day.
The strategic logic is clean: Meta does not need to be the issuer. It needs to be the distribution layer. By partnering rather than building, the company avoids the regulatory trap that killed Libra while capturing transaction fees and payment data across its ecosystem. For the stablecoin market - which currently sits at approximately $230 billion in total supply, dominated by Tether's USDT and Circle's USDC - Meta's entry would represent the biggest potential demand shock since the inception of the asset class.
This is institutional adoption wearing consumer clothing. When a company with $1.5 trillion in market capitalization decides to pipe dollar-denominated crypto through three billion user accounts, that is not speculation. That is infrastructure investment with a return horizon measured in decades.

U.S. spot Bitcoin ETFs posted $500 million in net outflows for Q1 2026, according to SoSoValue data compiled by multiple outlets. That headline number looks terrible. It is also deeply misleading if you do not break it down by month.
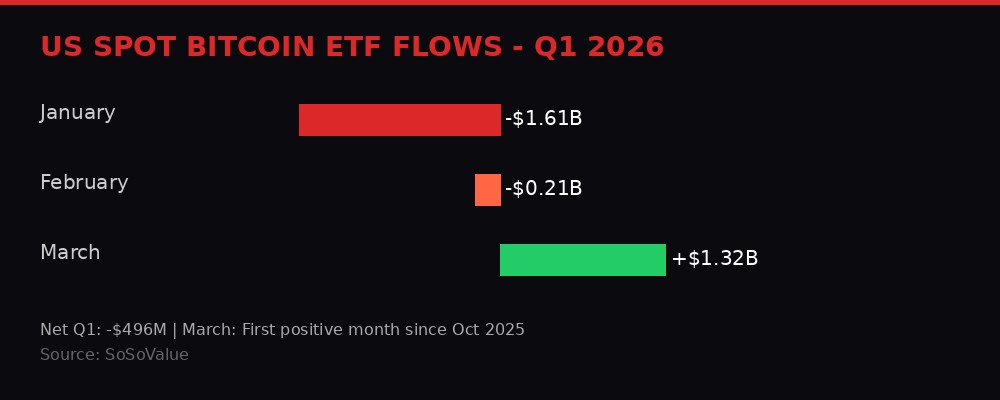
January was a massacre: $1.61 billion in net outflows as geopolitical fears around the Iran conflict sent institutional allocators scrambling for safety. February saw another $206 million exit. But March flipped: $1.32 billion in net inflows, the first positive month since October 2025 and the strongest single-month inflow reading since the initial post-approval euphoria.
The inflection point was visible in real-time. On March 17, BlackRock's iShares Bitcoin Trust (IBIT) absorbed $199 million in a single trading session, breaking a five-week consecutive outflow streak. That single-day flow represented more capital than many altcoins have in total market capitalization. Two days later, the FOMC held rates steady at 3.5%-3.75% for a second consecutive meeting, and the market briefly rallied before geopolitical risk reasserted itself.
The March reversal is significant because ETF flows are the most reliable proxy for institutional behavior in crypto. Retail traders use exchanges. Institutions use ETFs. When IBIT attracts $199 million in a single session during extreme fear conditions, it means institutional allocators are not waiting for the bottom. They are building positions into weakness - exactly what the on-chain whale data confirms.
Fidelity Digital Assets published research in late March arguing that even a small 1%-3% Bitcoin allocation can "materially improve returns and Sharpe ratios without significantly increasing drawdowns." Jason Fernandes, co-founder of AdLunam and a market analyst who has tracked institutional behavior since 2020, put it bluntly: "The risk is not about owning bitcoin anymore. It is the opportunity cost of having no exposure at all."
That framing shift - from "should we own this?" to "can we afford not to?" - is the institutional tipping point. It does not require price recovery to take hold. It requires exactly the conditions that exist right now: compressed drawdowns, a maturing market structure, regulatory clarity expanding globally, and fear so extreme that assets are being sold below global benchmark prices in Asian markets.

On April 1, Fidelity Digital Assets analyst Zack Wainwright posted on X that Bitcoin's growth is becoming "less impulsive," with a reduced probability of extreme downside events as the asset matures. The current drawdown from the October 2025 all-time high of $126,200 is approximately 46% - severe, but structurally different from previous cycles.
After the 2013 peak of $1,163, Bitcoin fell 87% to $152 by January 2015. After the 2017 peak of $20,000, it dropped 84% to $3,122 over 12 months. After the 2021 peak of $69,000, it fell 77% to $15,500 during the FTX collapse. The pattern is clear: each successive cycle produces smaller maximum drawdowns. From 87% to 84% to 77% to (so far) 46%.
Jason Fernandes offered the structural explanation: "Bitcoin's drawdowns compressing to about 50% is a sign of a maturing market structure. As liquidity deepens and institutional participation increases, volatility naturally compresses on both the upside and the downside." The capital required to move a $1.3 trillion asset 90% is vastly greater than the capital required to move a $20 billion asset the same distance. Scale itself is a stabilizing force.
Not everyone agrees. Bloomberg Intelligence's Mike McGlone told CoinDesk he believes bitcoin could still see a "normal reversion" toward $10,000, arguing that "the crypto bubble is over" and that any downturn could coincide with broader declines across equities, commodities, and other risk assets. Fernandes, who has publicly dissented with McGlone's $10,000 forecast before, countered that institutional integration - from ETFs to pension exposure - makes large-scale unwinds "structurally harder" because the capital is locked in products with different redemption mechanics than exchange-traded spot.
The implication for portfolio construction is already showing up in allocation models. Fidelity's research showed that in a 10-year comparison across major asset classes, bitcoin delivered roughly 20,000% returns while leading on risk-adjusted measures despite its volatility. "Bitcoin remains a relatively young asset, yet it has quickly matured into a major asset class and has been the top-performing asset in 11 out of the past 15 years," the Fidelity report noted.
But Fernandes added a nuance that most bull-case analyses miss: "There is a tradeoff here worth articulating. As bitcoin matures and volatility compresses, you should also expect returns to normalize. The asymmetric upside of the early cycles came with extreme drawdowns. As those drawdowns shrink, the asset increasingly behaves like a macro allocation rather than a venture-style bet." Translation: the 20,000% era is probably over. But so is the 90%-crash era. What remains is something that looks more like gold with a growth premium - and that is exactly what institutional portfolios want.
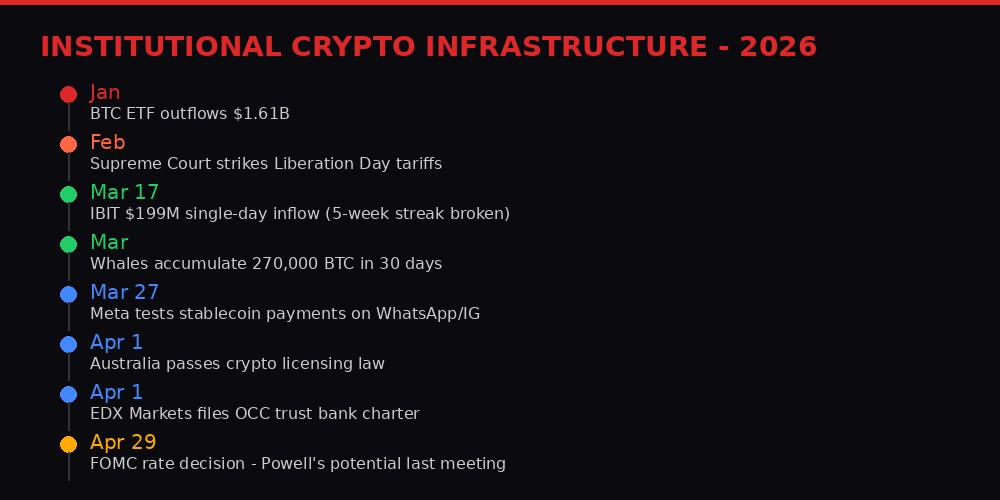
All of this institutional infrastructure is being built against a macro backdrop that remains genuinely treacherous. Trump's "Liberation Day" tariffs, originally imposed in April 2025 under the International Emergency Economic Powers Act, were struck down by the Supreme Court in February 2026. The ruling invalidated the legal basis for the sweeping tariffs, but the administration immediately reimposed a blanket 15% rate and has been searching for alternative legal authorities to escalate further.
The one-year anniversary of Liberation Day falls on April 2, 2026 - tomorrow. Analyses from the Tax Foundation, the National Taxpayers Union, and The Economist all reached similar conclusions: the tariffs failed to reduce the trade deficit (which actually increased), failed to drive meaningful reshoring of manufacturing, and created sustained supply chain uncertainty that continues to depress business investment. DW reported that with the new 15% blanket rate in place and the administration "seemingly determined to find other ways to levy higher duties again, exporters and importers alike are left guessing what the coming months may bring."
For crypto, the tariff overhang matters because it feeds into the Fed's rate calculus. The FOMC held rates steady at 3.5%-3.75% for a second consecutive meeting in March, but the April 29 meeting could be consequential. Phemex analysis noted that the April FOMC "could be Powell's last meeting as Chair, and any surprise hawkish language would add fuel to a breakdown." The Iran conflict, still unresolved after weeks of strikes and counterstrikes, adds another risk vector: energy prices remain elevated, which feeds inflation expectations, which constrains the Fed's ability to cut.
The crypto market is caught between two forces: institutional infrastructure buildout (bullish structural force, medium-to-long term) and macro tightening risk (bearish cyclical force, near term). The whale accumulation data, the ETF flow reversal, and the regulatory clarity expansion all point toward the former. The Fed, the tariffs, and the geopolitical risk all point toward the latter. In the short run, price will be determined by which force dominates. In the long run, infrastructure always wins. Institutions know this. That is why they are building now.

Intellectual honesty requires mapping the scenarios where the institutional buildout thesis breaks. There are three.
Scenario one: the Fed pivots hawkish. If inflation data comes in hot through April and the FOMC signals rate hikes instead of cuts, every risk asset - including bitcoin - reprices violently downward. The 46% drawdown becomes 60%+. Institutional allocators freeze new deployments. ETF outflows resume. The whale accumulation turns into whale capitulation. McGlone's $10,000 target starts looking less like a fringe call and more like a reasonable reversion. Probability: low but nonzero. The Fed has held at 3.5%-3.75% for two meetings. Moving to 4%+ would require a significant inflation surprise.
Scenario two: a major exchange or custodian fails. The crypto industry has not stress-tested its infrastructure under combined macro and geopolitical pressure since FTX collapsed in 2022. If a Tier 1 exchange (Binance, Coinbase, Kraken) or a major custodian faces a liquidity crisis, the institutional thesis evaporates overnight. Trust takes years to build and seconds to destroy. The EDX charter filing, the Australia licensing law, the Meta stablecoin push - all of it becomes meaningless if another custody failure proves the skeptics right. Probability: low. Post-FTX regulatory scrutiny has forced most major platforms to publish proof-of-reserves and segregate customer funds.
Scenario three: Iran escalation triggers a genuine financial crisis. The ongoing conflict in the Gulf has already disrupted shipping through the Strait of Hormuz and pushed oil above $100. If the conflict escalates to direct confrontation between the U.S. and Iran, energy prices spike, inflation expectations reset higher, and the global economy tips into recession. In that scenario, bitcoin does not act as a safe haven - it acts as a risk asset and sells off alongside equities. The institutional buildout continues but on a much longer timeline. Probability: moderate. The conflict is ongoing, and de-escalation talks have been volatile.
These are real risks. They are not reasons to ignore the infrastructure signal. They are reasons to understand that the signal operates on a different timescale than the noise.

The numbers for April are already setting up. Here is the calendar that matters:
April 2: Liberation Day anniversary. One year of tariff fallout. Expect retrospective analysis from every major outlet, potential policy announcements from the White House, and increased volatility as macro funds rebalance around the anniversary narrative.
April 29: FOMC rate decision. The Fed held at 3.5%-3.75% in March. Markets currently price a hold for April as well, but this could be Jerome Powell's final meeting as Chair. Any deviation from expectations - or unexpected language about inflation, tariffs, or the Iran conflict's economic impact - moves everything.
Mid-April: Australia's crypto licensing framework enters its six-month compliance window. Exchanges operating in Australia must begin the AFSL application process or face enforcement action. Expect announcements from Kraken, OKX, Coinbase, and Independent Reserve regarding their compliance timelines.
Ongoing: The EDX OCC charter review process typically takes 12-18 months. No immediate impact, but the filing itself signals intent. Expect competitor responses - Coinbase, BitGo, and others have been circling banking charters for years.
Options markets are showing negative gamma at both $65,000 and $75,000, according to CuriousCryptos analysis. This means any breach of either level gets reinforced by market makers hedging in the same direction - a volatility amplifier that makes the range between $65K and $75K a coiled spring. A break below $65K likely accelerates toward $58K-$60K. A break above $75K likely accelerates toward $80K-$85K. There is very little room for a middle ground.
The Ethereum Glamsterdam upgrade - the most significant technical overhaul since the Merge - is targeting a June 2026 launch with a gas limit increase from 60 million to 200 million per block and throughput scaling to 10,000 transactions per second. If that launch goes smoothly, it could catalyze a rotation back into ETH and the broader altcoin market, reversing the BTC dominance trend that has defined Q1.
Bipartisan crypto market structure legislation is reportedly close to a deal in Congress. If signed before the end of Q2, it would provide the comprehensive federal framework that the U.S. has lacked for years, potentially triggering the same institutional confidence boost that MiCA provided in Europe.
Zoomed out: Q2 2026 opens with the most divergent signals in crypto history. Sentiment is at its mathematical floor. Fear is maxed out. Retail has capitulated. But the infrastructure layer - the regulated custody, the banking charters, the licensing frameworks, the ETF flows, the whale accumulation, the stablecoin integration into consumer platforms - has never been stronger.
The market is telling two stories at two different frequencies. The fast story is pain. The slow story is buildout. History suggests the slow story wins. But history also suggests that the transition from one to the other is never clean, never predictable, and never kind to impatient capital.
The institutions are not impatient. That is the signal.
Get BLACKWIRE reports first.
Breaking news, investigations, and analysis - straight to your phone.
Join @blackwirenews on Telegram