The Negative Gamma Trap: How Options Dealers Built a $400 Million Crash Machine Under Bitcoin

Bitcoin is trading at $66,700. That number does not tell you the real story. The real story is underneath the price - in the options market, where a self-reinforcing feedback loop has turned market makers into involuntary sellers and transformed a geopolitical headline into a $403 million liquidation event that wiped out 137,031 traders in under 24 hours.
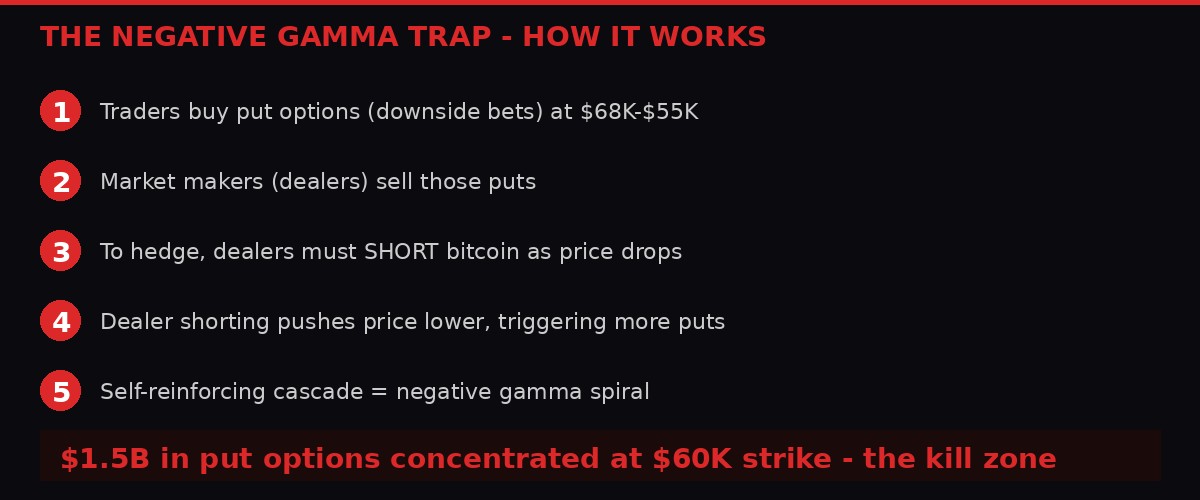
This is the negative gamma trap. It is one of the most dangerous structural setups in derivatives markets, and it is sitting directly below Bitcoin right now, loaded with $1.5 billion in put options concentrated around the $60,000 strike on Deribit. If price drops into that zone, options dealers do not get a choice about whether to sell. They are forced to, by the mechanics of hedging. And their forced selling pushes price lower, which forces more selling, which pushes price lower again.
It is the financial equivalent of a chain reaction. And on April 2, 2026, that reaction came dangerously close to going critical.
The Trigger: Trump's "Stone Ages" Speech and the Oil Shock

The catalyst hit at roughly 9 PM Eastern on Wednesday, April 1. President Donald Trump delivered a national address from the Oval Office in which he declared the U.S. campaign against Iran would escalate dramatically. His exact words were blunt even by his standards.
"Over the next two to three weeks, we're going to bring them back to the stone ages where they belong."
Markets had spent the previous 48 hours pricing in de-escalation. Diplomatic signals earlier in the week suggested a possible ceasefire pathway, and Bitcoin had briefly reclaimed $69,000 on Tuesday's optimism. The speech obliterated that thesis in under 30 seconds.
Brent crude jumped 10% overnight to $108 per barrel. Nasdaq 100 futures dropped 1.5%. S&P 500 futures fell 1.1%. The U.S. Dollar Index climbed above 100, adding a secondary headwind for crypto. Bitcoin broke below $68,000 within the first hour, and by Thursday morning was pressing $66,200, according to CoinDesk data.
Ether took it worse, falling 4.4% as DeFi tokens got hammered. CoinDesk's DeFi Select Index (DFX) lost 5.9%, its worst single-day performance in three weeks. Ethena (ENA) dropped over 10%. Uniswap, Lido, Sky, and Aave shed between 4.2% and 6.5%.
But the headline numbers miss the structural story. This was not just a geopolitical selloff. It was a geopolitical selloff amplified by a derivatives market that had been engineered - whether by accident or design - to cascade.
BTC: $66,700 (-2.4%)
ETH: $2,043 (-4.4%)
Total Crypto Market Cap: $2.37T (-2.6%)
Brent Crude: $108/bbl (+10%)
Fear & Greed Index: 8/100 (Extreme Fear)
24h Liquidations: $403M across 137,031 traders
DXY: 100.3 (+0.5%)
Nasdaq 100: -1.5% | S&P 500: -1.1%
Inside the $403 Million Liquidation Cascade
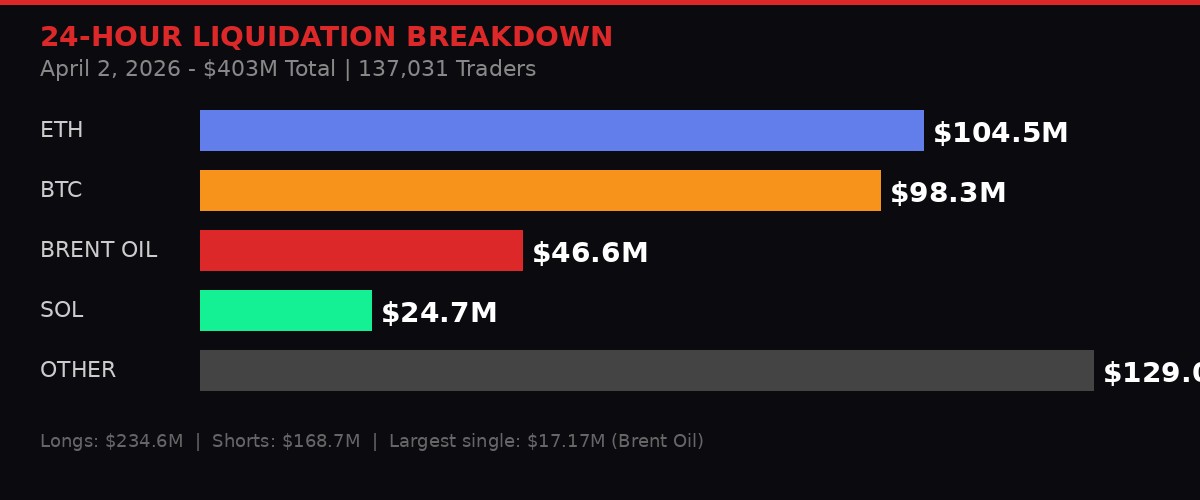
According to CoinGlass data cited by CoinDesk, $403 million in futures positions were liquidated over the 24-hour period ending Thursday afternoon. That represents a 17% increase over the previous day's liquidations and marks the third time in two weeks that daily liquidations have exceeded $350 million.
The breakdown tells a story that would have been impossible 12 months ago. Ether led with $104.5 million in liquidated positions. Bitcoin came second at $98.3 million. But the third-largest liquidated asset was not a cryptocurrency at all - it was tokenized Brent crude oil on Hyperliquid, which accounted for $46.6 million in forced closures. Solana came in fourth at $24.7 million.
The single largest individual liquidation across all assets was a $17.17 million Brent oil position on Hyperliquid. Not Bitcoin. Not Ether. Oil. This is the second time in under 30 days that an oil trade has produced the largest individual liquidation on a crypto venue.
The BRENTOIL-USDC contract on Hyperliquid traded at $107.19, up roughly 2% on the day, with $977 million in 24-hour volume and $515 million in open interest. For context, that open interest figure exceeds the entire market capitalization of hundreds of mid-cap crypto tokens.
Of the $403 million total, longs absorbed the heavier hit at $234.6 million versus $168.7 million in shorts. That asymmetry reflects the core mistake: traders had positioned for de-escalation, going long crypto and short oil. When Trump reversed course, they got hit from both directions simultaneously.
The four-hour window around the address saw $153.7 million liquidated, with $130.8 million coming from longs alone. That is the fastest clip of long liquidations since the March 23 selloff, when a similar Trump remark about Iran triggered $415 million in 24-hour liquidations.
The Negative Gamma Zone: A Self-Reinforcing Crash Mechanism
Here is where the story turns from bad to structurally dangerous. According to CoinDesk's derivatives analysis, Bitcoin's options market has built a "negative gamma zone" between $68,000 and the mid-$50,000s. This is not speculation. It is observable in the positioning data on Deribit, the dominant crypto options exchange.
To understand negative gamma, you need to understand how market makers hedge. When a trader buys a put option - a bet that Bitcoin's price will fall - the market maker on the other side of that trade needs to hedge. They do this by selling Bitcoin in proportion to the option's delta (its price sensitivity). As Bitcoin's price falls toward the put strike, the delta increases, which means the market maker must sell more Bitcoin to stay hedged.
In a normal market, this hedging activity is minor and gets absorbed by natural buyers. But when put options become heavily concentrated at specific price levels - as they are now around $60,000 - the hedging flows become enormous. And because every act of hedging (selling Bitcoin) pushes the price closer to the strike, it creates a feedback loop.
Glassnode's Week 13 on-chain report, published April 2, confirmed that gamma positioning had been in negative territory through much of March, though it noted signs of recent stabilization. "In a context where volatility is priced above realized and gamma is negative, it takes relatively little selling pressure for moves to extend, as the market adjusts quickly from a compressed base with limited positioning to absorb flows," the report stated.
According to Deribit data cited by Bloomingbit, $1.5 billion in put options are concentrated around the $60,000 strike level. That figure represents the "kill zone" - the price level where dealer hedging pressure would become most intense. If Bitcoin breaks below $65,000 with momentum, the path to $60,000 is not a gentle slide. It is a conveyor belt.
"Heavy demand for downside protection in Deribit-listed put options between $68,000 and the mid-$50,000s has created a negative gamma zone that can force dealers to sell more bitcoin as price falls." - CoinDesk Derivatives Report, April 2, 2026
The irony is sharp. Options were invented to manage risk. In this configuration, they amplify it. The people buying puts think they are protecting themselves. What they are actually doing is building a machine that makes crashes worse for everyone, including themselves if they hold any spot Bitcoin alongside those puts.
59 Days of Extreme Fear: The Longest Panic Since FTX
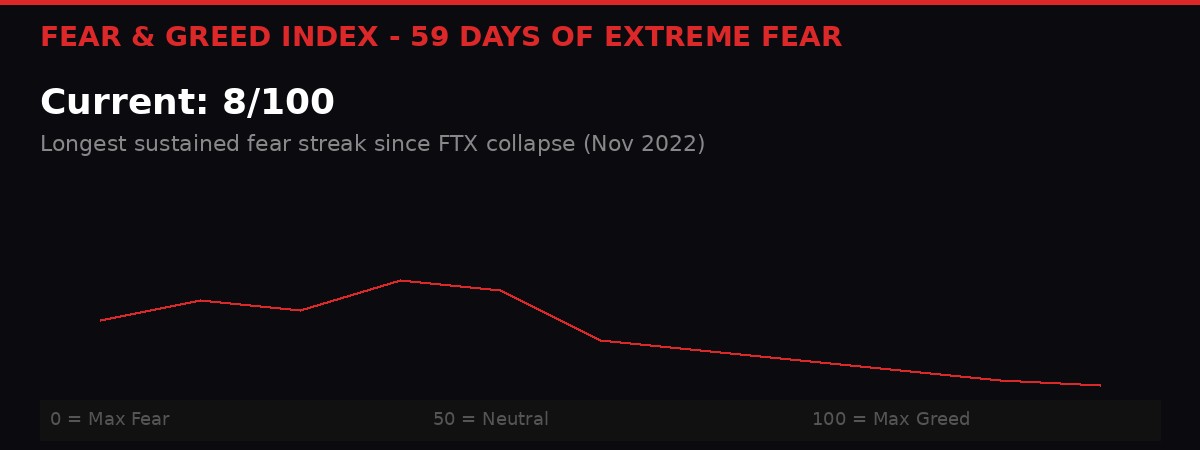
The Crypto Fear & Greed Index, which aggregates volatility, market momentum, social media activity, Bitcoin dominance, and Google Trends data into a single 0-100 score, registered 8 out of 100 on April 1, 2026. By April 2, it had recovered marginally to 12 - still deep in "Extreme Fear" territory.
More significant than the number itself is the duration. According to analysis by Spoted Crypto, the index has now spent 59 consecutive days below 25, marking the longest sustained period of extreme fear since the FTX exchange collapse in November 2022. That streak began on February 2, coinciding with the initial Iran escalation and the oil price shock that followed.
For historical context, the FTX-era fear streak lasted 51 days. The current streak has already exceeded it by over a week, and there is no obvious catalyst for a sentiment reversal on the horizon. The Iran war shows no signs of de-escalation. Oil remains above $100. The Fed has given no indication of emergency rate cuts. And the Fear & Greed Index for the broader stock market is equally dire at 14 out of 100.
CoinMarketCap's "altcoin season" index has dropped from 50 to 42 since March 30, highlighting relative weakness across the sector. Bitcoin dominance continues to climb, a classic defensive rotation pattern where capital exits small-caps and retreats to the relative safety of BTC.
Derivatives positioning confirms the pessimism is not just retail sentiment. BTC perpetual funding rates have dropped to their most negative since March 12, indicating that leveraged traders are actively paying a premium to hold short positions. For Ether, funding rates are at their most negative since October 2025. Traders are not just scared. They are positioning for more downside.
Fear & Greed Index: 8/100 (Extreme Fear)
Days Below 25: 59 consecutive (longest since FTX Nov 2022)
BTC Funding Rate: Most negative since March 12
ETH Funding Rate: Most negative since October 2025
Altcoin Season Index: 42/100 (down from 50 in 3 days)
BTC Puts vs Calls: Puts remain pricier across ALL tenors on Deribit
30-Day Implied Volatility: Flat (orderly selling, not panic)
Yet there is a paradox buried in the data. Despite the extreme fear reading, Bitcoin and Ether's 30-day implied volatility indices remain flat within recent ranges. CoinDesk's derivatives team interprets this as "orderly selling in the spot market rather than panic." The implication: smart money is not panicking. It is methodically positioning for a move lower while retail sentiment has already capitulated.
The Glassnode View: 8.4 Million BTC Underwater and Counting

The structural picture extends far beyond today's liquidation numbers. Glassnode's Week 13 on-chain report, released on April 2, paints a picture of a market caught in a prolonged distribution phase that has not yet completed its cycle.
Total Supply in Loss - the total number of circulating Bitcoin that was last moved at a price above the current spot level - currently sits at approximately 8.4 million BTC when smoothed with a 30-day moving average. That means roughly 40% of all circulating Bitcoin is underwater. The UTXO Realized Price Distribution (URPD) shows a dense overhead supply cluster stretching from $80,000 to $126,000, all of it purchased during the 2025 euphoria phase.
Glassnode draws an explicit parallel to Q2 2022 - the period just before the Luna/Terra collapse that sent Bitcoin from $30,000 to $17,000. In that episode, approximately 3 million BTC needed to change hands - moving from loss-realizing sellers to new buyers at lower prices - before the market could reclaim its cycle midline. The report suggests a similar redistribution process is underway now.
Long-Term Holder Realized Loss has climbed to $200 million per day since November 2025, confirming active capitulation among holders who bought above $80,000 more than six months ago. Glassnode identifies a cooldown below $25 million per day in long-term holder losses as the key threshold for base formation. At $200 million per day, the market is approximately eight times above that level.
Corporate treasury flows have also fractured. Marathon Digital (MARA) has sold roughly 15,000 BTC in recent months to manage debt obligations, representing one of the clearest examples of a corporate treasury reducing exposure rather than adding. Strategy (formerly MicroStrategy) remains the only consistent large-scale buyer, but even their activity has become more sporadic.
Coinbase Spot Volume Delta has turned marginally positive, suggesting that spot buyers are beginning to absorb sell-side pressure. But Glassnode cautions that "the scale of positive delta remains modest, indicating that demand is still tentative rather than conviction-led." Historically, durable recoveries have required sustained periods of positive spot flow, not tentative probes.
Metaplanet's Power Move: Japan's Answer to Strategy Overtakes MARA
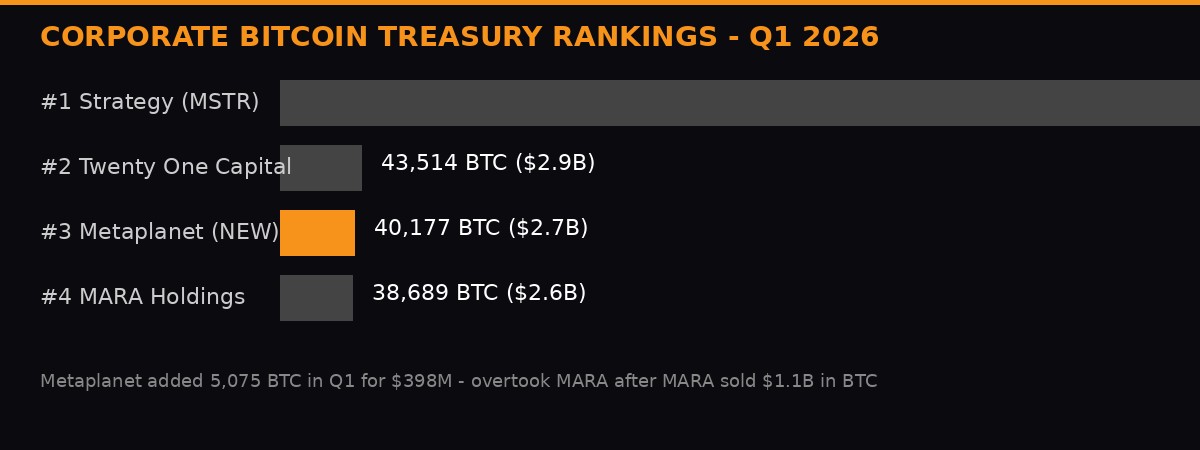
In a market where most corporate treasuries are either selling or freezing, one company is doing the opposite - and doing it aggressively enough to rewrite the leaderboard.
Metaplanet Inc. (TSE: 3350), the Tokyo-listed investment firm that pivoted from hospitality to Bitcoin in 2024, disclosed on April 2 that it acquired 5,075 BTC for approximately $398 million during Q1 2026. That purchase brings its total reserves to 40,177 BTC worth roughly $2.7 billion at current prices, and vaults Metaplanet past MARA Holdings to become the third-largest publicly traded corporate Bitcoin holder in the world.
The ranking now reads: Strategy (538,200 BTC, $35.7B), Twenty One Capital (43,514 BTC, $2.9B), Metaplanet (40,177 BTC, $2.7B), and MARA Holdings (approximately 38,689 BTC, $2.6B). The gap between Metaplanet and Twenty One Capital is just 3,337 BTC - roughly $221 million at current prices. At Metaplanet's current acquisition pace, it could close that gap within a single quarter.
The numbers are staggering when placed in context. At the start of 2025, Metaplanet held fewer than 2,000 BTC. In roughly fifteen months, its reserves have grown approximately 2,180%. The company targets 100,000 BTC by the end of 2026 and 210,000 BTC by the end of 2027 - figures that would place it second only to Strategy.
How Metaplanet funds this accumulation is almost as interesting as the accumulation itself. The company's Bitcoin Income Business generated about $19.8 million in revenue during Q1 through options-based income strategies, translating to roughly $3,900 per BTC acquired. That effectively reduces the net acquisition cost by partially offsetting purchases through premium income. The firm reported a BTC Yield of 2.8% for Q1 2026, a metric that measures growth in Bitcoin holdings relative to share dilution.
The Q1 acquisition followed a $255 million raise in late March, with proceeds allocated entirely to Bitcoin purchases. If outstanding warrants are exercised, total funding could climb to $531 million, supporting continued large-scale accumulations.
MARA's fall from third to fourth is equally telling. The mining company sold $1.1 billion in Bitcoin to manage debt, reducing its stack from above 53,000 BTC at peak to approximately 38,689 BTC. That is the difference between buying the dip and being forced to sell into it. MARA had debt. Metaplanet had a funding strategy. The leaderboard changed because of that distinction.
Hyperliquid's Quiet Revolution: When Oil Becomes a Crypto Trade

The fact that a tokenized oil contract produced the largest single liquidation in crypto on April 2 is not an anomaly. It is a structural shift.
Hyperliquid's tokenized commodity contracts give traders 24/7 access to oil, gold, and other macro assets with crypto-native leverage. The BRENTOIL-USDC contract has $515 million in open interest and nearly $1 billion in daily volume. Those numbers rival many top-30 crypto tokens.
CoinDesk reports that tokenized oil has now appeared among the top five liquidated assets on crypto venues on at least three separate occasions since the Iran war began. Before Hyperliquid listed these contracts, this category of liquidation simply did not exist. Crypto traders were insulated from direct commodity exposure. Now they carry it alongside their Bitcoin and Ether positions, creating correlation channels that never existed before.
The traders who got liquidated on April 2 followed a specific playbook: long crypto, short oil, betting on ceasefire. When Trump reversed course, both legs of the trade moved against them simultaneously. This is not just a crypto-internal liquidation cascade. It is a multi-asset liquidation cascade happening on crypto rails.
The implications go beyond Hyperliquid. As crypto exchanges increasingly list tokenized versions of traditional assets - equities, commodities, forex, credit derivatives - the liquidation surface area expands. A geopolitical shock that moves oil prices now creates forced selling in Bitcoin, because the same traders, on the same platforms, with the same margin, are holding both.
This is the merger of traditional finance risk and crypto market structure that nobody voted for. It arrived organically, through product innovation and trader demand, and it means that Bitcoin's correlation with oil, equities, and the dollar is no longer just statistical. It is mechanical.
EthCC Cannes: The Bankers Arrive While the Market Burns

While $403 million in positions were being liquidated on Thursday, 600 institutional professionals were sitting in the JW Marriott in Cannes, France, at EthCC's inaugural institutional forum called "The Agora," curated by market data provider Kaiko. The juxtaposition is almost satirical, but it captures the split reality of crypto in April 2026.
EthCC [9], running March 30 through April 2, has decisively shifted from a builders' retreat to an institutional showcase. For the first time in the conference's history, representatives from Bloomberg, S&P Global, BNP Paribas, Euroclear, Amundi, SG Forge, Google, and Tradeweb appeared on the official agenda. Jean-Marc Stenger, CEO of SG Forge (Societe Generale's crypto arm), shared the stage with Aave founder Stani Kulechov. Euroclear's Isabelle Delorme was cited as evidence of what French outlet CrypCool called "l'institution est desormais dans la salle" - the institutions are now in the room.
The agenda at The Agora was not about token launches or meme coins. It was about plumbing: tokenization of financial instruments, perpetual futures regulation, collateral mobility between centralized and decentralized venues, and the convergence of CeFi and DeFi infrastructure under Europe's Markets in Crypto-Assets Regulation (MiCA), expected to reach full implementation by mid-2026.
Aave chose EthCC as the launchpad for its V4 upgrade, activating a new "hub-and-spoke" architecture on Ethereum mainnet. The upgrade introduces three liquidity hubs - Core, Prime, and Plus - that route credit to specialized "spokes" designed for real-world assets (RWAs), fixed-rate lending, and institutional structured credit. The protocol currently holds over $24 billion in TVL and has processed more than $3.33 trillion in total deposits since launch. V4 is not a minor version bump. It is a fundamental redesign that positions Aave as on-chain credit infrastructure for regulated institutions.
But here is the dark side of the institutional pivot. Crypto.news reported that women's visibility at EthCC 2026 dropped markedly, with attendees noting a decline in female participation as crypto companies accelerate layoffs in marketing, PR, and events - roles that disproportionately employed women. The institutional turn brings capital but also the demographics and culture of traditional finance, where gender diversity has been a persistent struggle.
The Dollar Paradox: DXY Above 100 and What It Means

The dollar's behavior on April 2 deserves its own analysis because it compounds every other pressure on crypto. The DXY rose 0.5% to above 100, a psychologically significant level that it had not consistently held since early March.
A stronger dollar is mechanically bearish for Bitcoin through multiple channels. Dollar-denominated assets become more expensive for foreign buyers. Capital flows toward dollar-denominated treasuries and money markets, draining liquidity from risk assets. And for leveraged traders using USDT or USDC as collateral, dollar strength effectively reduces their purchasing power in real terms.
TronWeekly's April 2 analysis noted that Bitcoin "dropped 2% to $66,200 after rejecting $69,000," with the move coming "as Trump delivered a national address that triggered risk-off fears" and "US-Iran tensions intensified, pulling crypto prices down with stocks and gold." The dollar strength was not the primary driver but it acted as an amplifier - a headwind that turned a 1.5% selloff into a 2.4% one.
The broader macro setup is hostile. Oil above $100 means inflation pressure. Inflation pressure means the Federal Reserve cannot cut rates. No rate cuts mean no liquidity injection. No liquidity injection means risk assets - including crypto - face a funding drought that could persist for months.
Goldman Sachs has forecast that oil prices may moderate in the second half of 2026 if the Iran conflict reaches some form of resolution, which could provide a meaningful tailwind for Bitcoin. But "second half of 2026" is a long time to wait when your portfolio is underwater and funding rates are negative.
Algorand's Lonely Rally and the Rotation Signal
One asset bucked the trend on Thursday: Algorand (ALGO), which rose approximately 0.8% while everything else bled. That extends a rally of 22% over the past week, making it the standout performer in a sea of red.
The Algorand move is interesting less for its magnitude and more for what it signals. In extreme fear environments, capital does not just exit - it also rotates. Traders look for uncorrelated plays, technical setups at support, or fundamental catalysts that exist independently of macro headwinds. ALGO appears to be benefiting from a combination of relative value positioning and technical momentum after holding support at levels that many other altcoins broke below.
Meanwhile, privacy coin Zcash (ZEC) and Cardano (ADA) saw notable declines in open interest, a sign of capital outflows rather than active shorting. When open interest drops alongside price, it typically means traders are exiting positions entirely rather than taking new bets. That is liquidation fatigue - when traders simply refuse to play anymore.
The altcoin season index's drop from 50 to 42 in just three days confirms the broader rotation toward BTC dominance. In uncertain markets, traders retreat to the perceived safety of Bitcoin and stablecoins, leaving altcoins to absorb disproportionate losses. This pattern has repeated in every major risk-off episode since 2020, and there is no reason to expect it to reverse until macro conditions improve.
The Options Skew: Smart Money is Not Done Selling

The most concerning data point from April 2 is not the liquidation number or the price action. It is the options skew.
On Deribit, Bitcoin puts remain pricier than calls across all tenors. Every single expiry date shows a premium for downside protection over upside exposure. This is called a negative put-call skew, and when it persists across the entire term structure, it tells you that sophisticated traders - the ones who trade options rather than spot or perpetuals - expect more downside.
CoinDesk reports that block flows on April 2 featured "demand for ether straddles, a volatility strategy, and put spreads and bitcoin call spreads." The straddle demand on ETH suggests traders expect a large move in either direction but are not confident enough to pick one. The put spread demand on both assets is straightforward: it is a directional bet on lower prices, structured to limit cost.
The 30-day implied volatility remaining flat despite the selloff is particularly telling. In a genuine panic, implied vol spikes. When price drops and vol stays flat, it means the selloff was expected. The options market had already priced this move before Trump opened his mouth. His speech was the trigger, not the cause.
Glassnode's perpetual market analysis adds another layer. The Perpetual Market Directional Premium has compressed toward neutral and slightly below zero, "reflecting a reset in long-biased leverage and cooling speculative appetite." Bullish exposure is being actively unwound. Short-side interest is re-emerging. The futures market is more balanced but also more cautious - a setup that typically precedes either a consolidation or another leg down, not a reversal.
What Breaks the Cycle: Three Scenarios

Scenario 1: Geopolitical de-escalation. If the Iran conflict reaches a ceasefire or significant de-escalation in the 2-3 week window Trump himself identified, oil drops below $90, the dollar weakens, and the negative gamma trap defuses because puts expire worthless. This is the fastest path to a reversal and could produce a violent short squeeze given current positioning. Probability: low-to-moderate, given Trump's rhetoric trajectory.
Scenario 2: Gradual base formation. Price consolidates between $62,000 and $68,000 for 4-8 weeks while the 8.4 million BTC overhang slowly redistributes. Long-term holder losses cool from $200M/day toward the $25M/day threshold Glassnode identifies as necessary for base formation. The fear index slowly normalizes. The negative gamma zone gets resolved through time decay as put options expire. This is the most historically consistent scenario but requires patience that leveraged traders do not have. Probability: moderate.
Scenario 3: Negative gamma cascade to $60,000. A fresh geopolitical shock or macro disappointment pushes Bitcoin below $65,000 with momentum, triggering the full negative gamma feedback loop. Dealers dump spot Bitcoin to hedge their put exposure. Price accelerates through $62,000 toward the $60,000 kill zone where $1.5 billion in puts sit. Liquidations surge past $1 billion in 24 hours. The Fear & Greed Index hits single digits again. This scenario is not the most likely, but it is the most structurally supported by current positioning. Probability: moderate and rising.
The honest answer is that nobody controls what happens next. Trump controls the war timeline. OPEC controls the oil floor. The Fed controls rates. Bitcoin traders control none of those variables. What they do control is positioning, and right now, positioning says: brace for impact.
The Numbers That Matter Tonight
BTC Support: $65,000 (gamma transition zone) / $60,000 (max put OI, kill zone)
BTC Resistance: $69,000 (Wednesday rejection) / $72,000 (200-day MA)
ETH Support: $1,900 / $1,800
ETH Resistance: $2,100 / $2,250
Brent Crude: $108 current, $115 next resistance
DXY: 100.3 current, 101.5 next resistance
Fear & Greed: 12 (recovery from 8, still extreme fear)
CRITICAL THRESHOLDS
- LTH Realized Loss below $25M/day = base formation signal (currently $200M/day)
- Fear & Greed above 25 = fear streak broken (currently day 59)
- BTC Puts cheaper than calls on ANY Deribit tenor = sentiment shift
- Coinbase Spot CVD sustained positive = institutional demand returning
The negative gamma trap under Bitcoin is not theoretical. It is a measurable, observable market structure that converts small selling pressure into large price moves. Today's $403 million liquidation event was a demonstration, not the main event. The main event comes if price enters the $60,000 kill zone, where $1.5 billion in put options sit waiting to convert options dealers into involuntary sellers.
In 59 days of extreme fear, with 8.4 million BTC underwater, long-term holders capitulating at $200 million per day, and oil above $100 because the president just promised to bomb Iran "back to the stone ages" - the question is not whether the market is fragile. The question is how much force it takes to break it.
The options market has already given its answer. It built the machine. Now we wait to see if someone pulls the lever.
Get BLACKWIRE reports first.
Breaking news, investigations, and analysis - straight to your phone.
Join @blackwirenews on Telegram