Oil Hits $100, Bitcoin Cracks $70K: The Derivatives Unwind Tearing Through Crypto
Iran peace talks are dead. Oil is back above $100 a barrel. Bitcoin is trading at $68,971 - its lowest level in weeks. MARA just sold 15,133 BTC worth $1.1 billion. Altcoins are down 4-8% across the board. Derivatives traders are fleeing. This is what a real risk-off day looks like in crypto, 2026 edition.

Three variables converged overnight to produce the cleanest risk-off signal crypto has sent in weeks. First: Iran-U.S. peace negotiations, which briefly spooked markets into optimism, collapsed. Second: Brent crude and WTI spiked back above $100 per barrel - a psychological and practical barrier for every risk asset on the planet. Third: Bitcoin's 50-day range between $65,000 and $75,000 finally showed its teeth, with BTC cracking below $70,000 during the European session and sitting around $68,971 as of Thursday afternoon.
The derivative markets told the real story. Cumulative crypto futures open interest dropped 3.5% to $108.30 billion. Funding rates across ETH, BNB, XRP, SOL, TRX and DOGE all flipped negative - meaning traders are actively paying to hold short positions. That is not a market preparing to bounce. That is a market positioning for more downside.
This is not a one-off liquidity blip. The broader macro picture has been deteriorating for weeks. The Iran war is dragging into its second month. The Fed has shown zero willingness to cut rates. Bitcoin ETF inflows that looked promising in early March have slowed dramatically. And the market has been running on leveraged hope since early February - now that hope is being unwound, contract by contract, exchange by exchange.
The Iran Catalyst: Why $100 Oil Broke the Trade

Peace negotiations between the United States and Iran appeared to be making progress as recently as Tuesday. That optimism - however tentative - had allowed oil prices to ease back from their most extreme levels and permitted equity and crypto markets to stabilize around what analysts were calling a "ceasefire premium." By Thursday morning, that premium evaporated.
The breakdown in talks sent WTI crude surging back through the $100 per barrel level. The implications ripple outward instantly. Every basis point of oil inflation erodes the Federal Reserve's ability to justify rate cuts. Every rate cut that gets pushed back is risk capital that stays on the sidelines. Every dollar of risk capital that stays on the sidelines is a dollar not flowing into crypto.
The Strait of Hormuz remains under heightened tension following the death of Iran's Navy Chief earlier this week - a killing attributed to Israeli forces. With the U.S. 82nd Airborne now deployed in the region and the USS Gerald Ford operating out of Crete after sustaining damage, the military situation is fluid in a way that makes algorithmic trading systems default to risk-off every time a headline crosses the wire.
"Deadlock in the Iran-U.S. negotiations seems to have triggered renewed risk aversion, leading to capital outflows from crypto derivatives." - CoinDesk Markets analysis, March 26, 2026
The oil shock is particularly painful for the crypto thesis of 2026. The original bull case heading into the year was premised on: a resolution to Middle East hostilities, a resumption of Fed rate cuts, and continued institutional inflows into Bitcoin ETFs. Two of those three pillars are currently compromised. The third - ETF inflows - is weakening. The bullish scenario has not collapsed, but it has been delayed, possibly by months.
Consider what $100 oil means for the macro environment. At these prices, inflation expectations ratchet up. Consumer spending takes a hit as gas prices rise - and according to separate polling, Americans are already feeling the pain, with pump prices averaging $3.88 nationally. The Fed, which needs to see inflation trending decisively lower before cutting, now faces renewed pressure from the energy complex. Risk assets - Bitcoin included - price in rate expectations. Higher-for-longer rates mean discount rates stay elevated, which means speculative assets get compressed.
Derivatives Meltdown: What the Numbers Actually Say
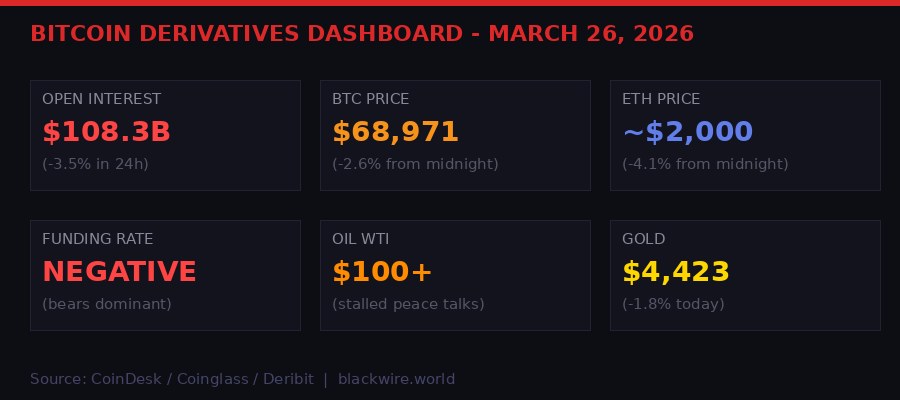
Strip away the narrative and look at what traders are actually doing. The cumulative crypto futures open interest number - $108.30 billion, down 3.5% in 24 hours - is the first tell. When open interest falls alongside price, it typically indicates long liquidations: leveraged bulls being forced out of positions rather than new shorts entering. That is a de-leveraging event, not a structural short attack.
The funding rate picture is more nuanced but equally bearish. Negative funding rates on ETH, BNB, XRP, SOL, TRX and DOGE mean that traders holding short positions are being paid to hold them - and traders holding long positions are paying a premium to stay in. That dynamic, when it persists, creates a self-reinforcing pressure that pushes prices lower until something breaks the cycle.
The PAXG (Paxos Gold) open interest data stands out as an interesting signal. PAXG OI fell nearly 11% in 24 hours alongside gold's 1.8% price decline. Gold has now posted its longest losing streak in over a century - 10 consecutive down days, the worst run since February 1920 according to Bloomberg analyst Katie Greifeld. When even gold, traditionally the ultimate risk-off asset, is bleeding out, it tells you something fundamental is happening to the risk-off trade itself. Capital is not rotating to safety. Capital is leaving.
On Deribit, the options market is reinforcing the bearish lean. BTC and ETH puts are more expensive than calls across all tenors - a sign the market is paying up for downside protection. At the front end of the curve, ETH puts are more expensive than BTC puts, which analysts at TDX Strategies interpret as traders bracing for a sharper near-term decline in Ethereum specifically. Some traders are explicitly running risk reversals: selling calls to fund put purchases, a directional bet on further downside with defined cost.
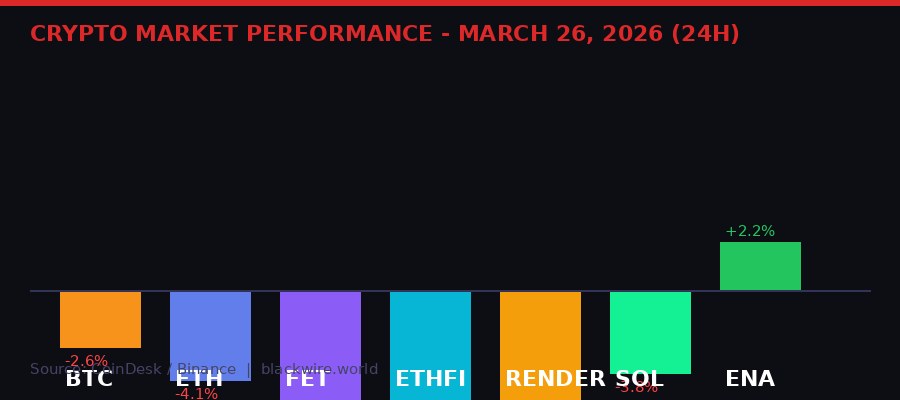
The only tokens posting gains in a top-100 scan are a handful of layer-1 names and Ethena (ENA, +2.2%), which benefits from its delta-neutral stablecoin model and yield-generating structure - the kind of asset that actually performs better in a falling-rate environment for perps. The pattern is consistent with risk rotation: traders fleeing speculative AI and DeFi tokens and either going to cash or moving to lower-beta assets with real yield mechanics.
The CoinDesk Computing Select Index (CPUS) fell 4.3% and the CoinDesk DeFi Select Index (DFX) dropped 3.9% during the Asia session, leading the broader market lower. AI tokens - which have had a volatile 2026 - are getting absolutely hammered. FET is down 7.7%. ETHFI dropped 6.3%. RENDER gave back 5.9%. These are tokens that were already struggling to hold gains from the past week; now they are seeing those gains fully erased in a single trading session.
MARA Drops 15,133 BTC: The $1.1 Billion Sale Wall

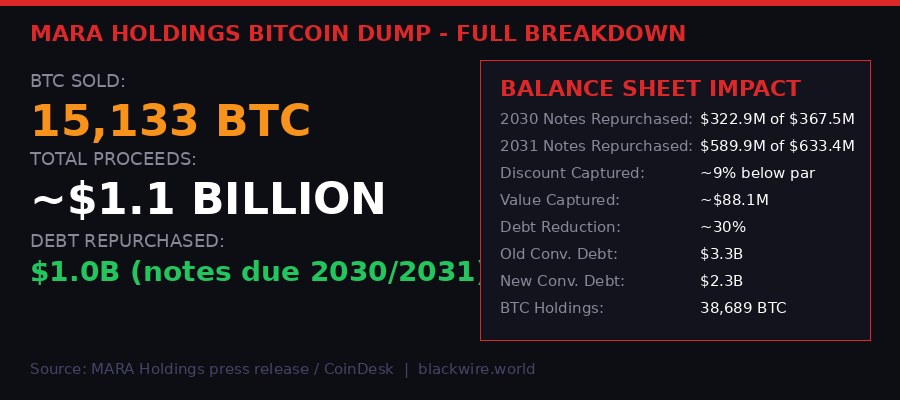
Here is something that does not happen in a bull market: the world's largest public Bitcoin mining company quietly liquidates $1.1 billion worth of its BTC holdings over three weeks, announces it after the fact, and its stock jumps 10%. That is exactly what MARA Holdings did on Thursday, and the market's response tells you a lot about where capital actually sits right now.
MARA sold 15,133 bitcoin between March 4 and March 25, generating approximately $1.1 billion in proceeds. The company used the cash to buy back roughly $1.0 billion of its 0.00% convertible senior notes due 2030 and 2031 at a discount - specifically $367.5 million of 2030 notes purchased for $322.9 million, and $633.4 million of 2031 notes purchased for $589.9 million. The discount averaged about 9% below par, generating $88.1 million in value capture for MARA shareholders.
CEO Fred Thiel framed the sale as a deliberate capital allocation decision rather than a distress event:
"Our decision to sell a portion of our bitcoin holdings reflects a strategic capital allocation move designed to strengthen our balance sheet and position the company for long-term growth." - Fred Thiel, CEO MARA Holdings, March 26, 2026
After the sale, MARA still holds 38,689 BTC. That is not nothing - it remains one of the largest corporate Bitcoin treasuries in the world. The convertible debt reduction also carries a meaningful strategic rationale. By cutting total outstanding convertible notes from approximately $3.3 billion to $2.3 billion, MARA materially reduces future shareholder dilution risk. Convertible notes, when they convert, create new shares that dilute existing holders. Buying them back at a discount eliminates that risk while capturing the discount as immediate value.
The market liked it. MARA shares climbed 10% in premarket trading. The stock market, at least, reads this as a company getting its house in order - not a company liquidating in distress. But zoom out: 15,133 BTC is a lot of selling pressure spread over three weeks. That is roughly 500 BTC per day hitting the market during a period when Bitcoin was already struggling to hold above $70,000. The question analysts will debate: how much of the price weakness we are seeing today was accelerated by MARA's sustained sell program?
There is a broader implication here that matters for the Bitcoin mining sector. The era of "hodl everything forever" corporate treasury strategy is being quietly revised. MARA needs cash to fund debt at 9% below par. Other miners will face similar balance sheet pressures as the post-halving revenue environment tightens. If more mining companies follow suit and liquidate BTC to clean up their capital structures, that creates a persistent seller pool that the market needs to absorb. It is not catastrophic, but it is not bullish either.
The 50-Day Consolidation: Bear Flag or Structural Base?

The bitcoin chart has become a Rorschach test. Look at the same 50-day range between $65,000 and $75,000 and you get wildly different interpretations depending on where you sit.
The bearish read: Bitcoin peaked above $126,000 in late 2024, sold off hard, and has been grinding lower for months. The recent consolidation is a classic bear flag - a brief pause in a broader downtrend that resolves to the downside, potentially targeting $55,000 to $60,000 if the pattern plays out. Some traders on Crypto Twitter are explicitly making this call, pointing to the October-to-now trend as the dominant structure.
The bullish read - which has more analytical support - is that the duration of the consolidation itself argues against the bear flag thesis. Bear flags, by definition, are short-lived pauses that last days, not seven weeks. A 50-day sideways grind is a completely different market structure. It suggests neither bulls nor bears have conviction, that the market is evenly balanced, and that a resolution could go either way. More importantly, the support built in this range is real: CoinDesk Research data shows more than 600,000 BTC accumulated at current levels during the drawdown, representing genuine cost-basis that creates demand on dips.
The Coinbase Premium - a key indicator of U.S. institutional demand - is currently at its most negative reading in over a month. When Coinbase trades at a discount to Binance, it signals that U.S. buyers are not the marginal bid. That matters because U.S. institutional flows have been the primary catalyst for Bitcoin's price action since the ETF launches in January 2024.
Bitcoin ETF data tells a mixed story. The 11 U.S.-listed spot Bitcoin ETFs saw $1.53 billion in net inflows in March, breaking a three-month streak of outflows. But the distribution is uneven: $1.3 billion arrived in the first half of March, with only $195 million in the second half. The pace is slowing exactly when prices need support.
"The signal here is that institutional demand has not disappeared. However, it is selective and less linear than in the strongest accumulation phases." - Vikram Subburaj, CEO, Giottus Exchange
The 2022 comparison matters here. Bitcoin's 2022 collapse was different in structure because the price had no real support built between $10,000 and $60,000 - the 2020-2021 rally was vertical and created no cost basis. The current drawdown from $126,000 is happening through a range where hundreds of thousands of BTC were accumulated in 2024. That is a materially stronger structural foundation. But structural support does not prevent further downside if macro conditions deteriorate sharply - it just makes any downside harder-earned and more likely to find real buyers.
Circle's $20 Billion Question: What the CLARITY Act Really Does
While the rest of crypto was bleeding Thursday, a separate but equally important story was unfolding in Washington and on Wall Street: the ongoing debate about what exactly the U.S. CLARITY Act does to Circle (CRCL) and the stablecoin market.
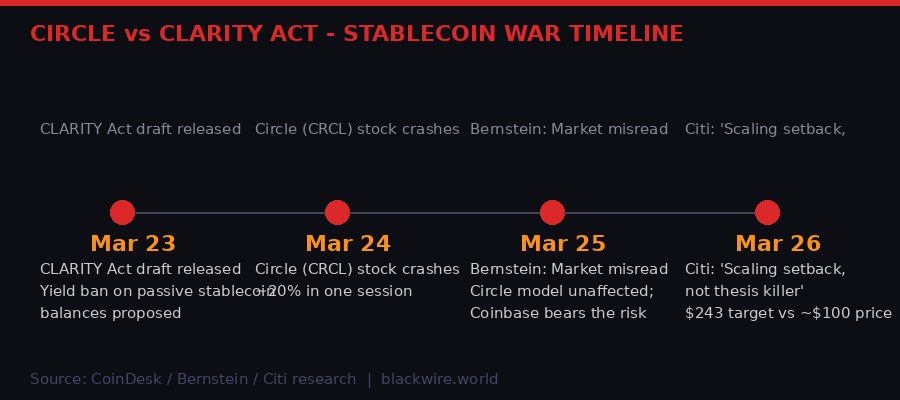
On Tuesday, a draft of the CLARITY Act surfaced with provisions that appeared to ban yield payments on passive stablecoin balances. The market reaction was swift and severe: Circle shares collapsed roughly 20% in a single session. The read was simple - if you cannot offer yield on USDC, demand for USDC collapses, Circle's growth thesis is destroyed, the stock is worth much less.
By Wednesday, Bernstein was out with a report calling the market reaction a misread. By Thursday, Citigroup joined with its own take. Both research desks reached similar conclusions: the market conflated who earns yield with who distributes it, and got the implications backwards.
Here is the actual structure: Circle earns reserve income from the T-bills and money market instruments backing USDC. That is Circle's revenue. Separately, platforms like Coinbase pass some of that reserve income to USDC holders as yield - that is the product that the CLARITY Act's draft language targets. The draft would ban yield on passive stablecoin balances but allow activity-based rewards tied to trading or payments. Circle does not pay yield to holders directly. Circle generated $2.64 billion in reserve income in FY2025, and none of that is threatened by the proposed rules.
"We view this development potentially (but not necessarily) as a scaling setback, but not a thesis killer." - Citi analyst Peter Christiansen, CLARITY Act research note, March 2026
Citigroup maintains a $243 price target on Circle stock. The shares were trading around $100 at time of publication - a significant discount to Citi's target that reflects either market uncertainty about the regulatory trajectory or a view that the stablecoin market's growth will slow regardless. Bernstein has an outperform rating with a $190 target and argues that USDC's $80 billion circulation is driven by trading, payments and collateral demand - not yield-chasing - meaning the fundamental adoption story remains intact.
Coinbase is caught in a more difficult position. The CLARITY Act, if passed as currently drafted, would force Coinbase to restructure its USDC yield product - approximately a 3.5% yield currently offered to users. Coinbase is reportedly dissatisfied with the bill's current language but is not publicly opposing it, a delicate dance that reflects the company's dependence on a favorable regulatory environment for its broader business. Circle, for its part, appears to have emerged from this legislative scare in better shape than initially feared - its model was simply misunderstood by the market.
The stablecoin policy fight is not over. A ban on yield, even if narrowly targeted at passive balances, signals the direction of regulatory travel. Washington is uncomfortable with stablecoins that look too much like bank deposits, pay interest, and operate outside the banking regulatory perimeter. That philosophical position will shape every subsequent rule the CLARITY Act produces - and every company in the stablecoin ecosystem will need to adapt.
Gold's Century-Worst Losing Streak vs. Bitcoin's Resilience
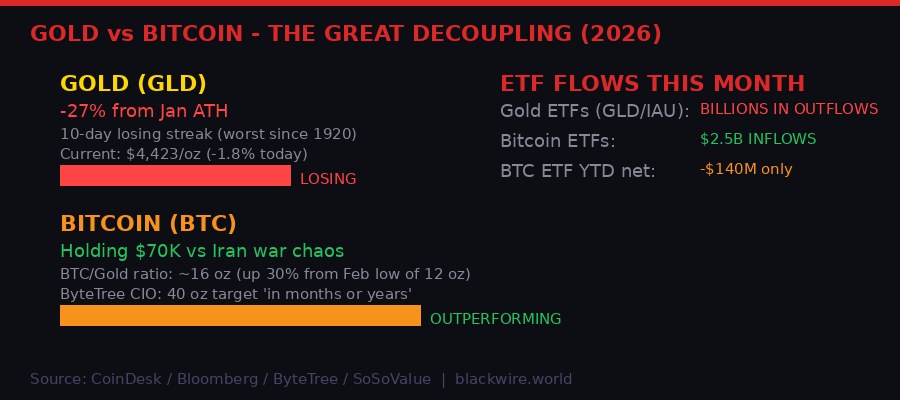
Gold is having a historically bad month. As of Wednesday, the yellow metal had notched 10 consecutive losing sessions - the longest losing streak since February 1920, according to Bloomberg analyst Katie Greifeld. Gold peaked at an all-time high in January 2026 and has since fallen as much as 27% to a low of $4,090, where it found support at the 200-day moving average.
The counterintuitive nature of gold's underperformance in a war environment is worth examining. Traditional financial theory says war = gold up. But the reality in 2026 is more complex. Gold's record run into January was itself driven by geopolitical tension - the market front-ran the war premium aggressively. When conflict escalated and then became a grinding reality rather than a brief shock, the trade unwound. Meanwhile, gold ETF outflows accelerated: SPDR Gold Trust (GLD) and iShares Gold Trust (IAU) saw billions in outflows in the past week alone, per Bloomberg ETF analyst Eric Balchunas.
Bitcoin's performance relative to gold stands in sharp contrast. While BTC is down from its $126,000 peak, it has dramatically outperformed gold during the Middle East conflict. The Bitcoin-to-gold ratio - measured in how many ounces of gold one bitcoin can buy - has risen roughly 30% since the conflict escalated at the end of February, from around 12 ounces to approximately 16 ounces today.
Charlie Morris, Chief Investment Officer at ByteTree, offered this historical perspective:
"I remember the excitement when 1 BTC first surpassed one ounce of gold in March 2017. Since then, it has consistently built higher lows, reaching 2.7 oz in 2019, 3.4 oz during the 2020 pandemic crash, 9.1 oz after the FTX collapse, and 12.4 oz in February this year. Now, one BTC is worth 16 ounces of gold. With gold appearing exhausted, we could reasonably expect a new all time high above 40 ounces in the coming months or years." - Charlie Morris, ByteTree CIO
Balchunas at Bloomberg argues that bitcoin and gold are largely uncorrelated rather than inversely related. The data supports this. Bitcoin ETF inflows have totaled $2.5 billion this month, even as gold ETFs hemorrhage capital. Year-to-date, Bitcoin ETFs have seen only $140 million in net outflows despite Bitcoin being down roughly 20% from its highs - a sign that long-term institutional holders are not panic-selling even as retail sentiment sours.
The divergence points to something structurally important. Gold's traditional "safe haven" narrative relies on the dollar-denominated global financial system staying intact. Bitcoin's value proposition is partly orthogonal to that - it is not a claim on any central bank's credibility, does not have the same supply inflation mechanisms, and has a different base of holders. Whether that difference translates into sustained outperformance against gold is an open question, but the 2026 data so far suggests the market is increasingly treating them as distinct assets rather than alternatives.
Altcoin Carnage: AI and DeFi Tokens Take the Worst of It

If you are holding AI tokens or DeFi positions right now, Thursday has not been kind. The CoinDesk DeFi Select Index fell 3.9% and the Computing Select Index - which tracks AI-adjacent tokens - dropped 4.3% during the Asia trading session, leading the global selloff before European markets opened and piled on more selling pressure.
The individual token carnage breaks down as follows, per CoinDesk data:
- FET (Fetch.ai): -7.7% - worst performer among major AI tokens
- ETHFI: -6.3% - gave back most of the past week's gains in one session
- RENDER: -5.9% - erased a week of gains as compute token demand waned
- ETH: -4.1% - heading back toward $2,000 support level
- DOGE: Negative funding rates; significant OI reduction
- ZEC, TAO: Among the top OI losers across all assets
- ENA (Ethena): +2.2% - one of few top-100 tokens in the green
- XDC, NIGHT, TRX: Between +1% and +2% - layer-1 resilience
The Altcoin Season index sits at 48/100 - technically neutral territory, just below the threshold that would indicate altcoins are broadly outperforming Bitcoin. That reading is somewhat misleading given today's carnage, because it captures a rolling measurement rather than a single-day snapshot. What matters more is the directional signal: liquidity across the altcoin market has been chronically thin since late 2025, and thin liquidity markets amplify drawdowns dramatically.
The AI token sector deserves specific analysis. FET, RENDER, and their peers had a significant run-up in late 2024 and early 2025 driven by a narrative that crypto-native AI tokens would benefit from the broader AI infrastructure buildout. The thesis was plausible but the execution was speculative - these tokens are trading on potential revenue, not current cash flows, and in risk-off environments, speculative premium is the first thing that gets stripped out.
FET's 7.7% single-day drop is particularly notable because Fetch.ai (now rebranded as the AI token within the Artificial Superintelligence Alliance) has positioned itself as a serious enterprise-grade AI agent platform. The price action suggests retail and institutional holders are not differentiating between "serious AI project" and "speculative AI token" when they need to raise cash quickly. In a risk-off environment, everything gets sold.
The question for altcoin holders is whether thin liquidity creates a deeper problem on the downside. Markets that lack depth can move 10%, 15%, 20% in short order if a trigger appears - and the triggers are clearly present: $100 oil, negative funding rates, a 50-day consolidation that bulls need to defend urgently. The Altcoin Season index at 48 suggests there is no altcoin-specific momentum to cushion a broader Bitcoin decline. If BTC breaks meaningfully below $65,000, the altcoin losses could be multiples of what we are seeing Thursday.
What Happens Next: Scenarios and Key Levels to Watch

The setup heading into the weekend is genuinely uncertain - which is to say it is more uncertain than it was last week, when the weight of evidence slightly favored the bulls. Here is the honest scenario analysis.
Bullish scenario: Iran-U.S. negotiations resume and show credible progress. Oil retreats below $90. Bitcoin defends $65,000 on any additional dip, ETF inflows reaccelerate, and the 600,000+ BTC accumulated at current levels creates a wall of demand that absorbs sell pressure. If BTC can recapture $72,000 with volume, the 50-day consolidation resolves to the upside and the $126,000 ATH comes back into conversation for Q3.
Bearish scenario: Iran talks stay broken. Oil stays above $100, feeding inflation expectations that keep the Fed on hold. The Coinbase Premium stays negative, signaling U.S. institutional buyers are on the sidelines. The 50-day range breaks to the downside. $65,000 gives way, opening up $58,000-$60,000 as the next technical support cluster. In this scenario, the "structural base" narrative collapses and the bear flag interpretation becomes the operative framework.
Base case: Neither. The market grinds sideways for another two to four weeks while geopolitical noise dominates. Oil oscillates between $95 and $105. Bitcoin trades $65,000-$72,000. Retail traders get bored and leave. Institutional flows slow further. Eventually something breaks the deadlock - either a policy signal from the Fed, a breakthrough in Iran talks, or a capitulation move that flushes remaining leverage.
Key levels traders are watching:
- BTC $65,000: First major support. Below this, the 50-day base thesis weakens substantially.
- BTC $60,000: The Feb 6 range low. Breaking here would be a technically significant event.
- ETH $1,900: Key psychological level. Options flow suggests traders are hedging for this.
- BTC ETF inflows: Need to see consistent $200M+ daily to signal institutional re-entry.
- Oil $95: A decline back below $95 would take significant pressure off macro risk assets.
- Coinbase Premium: Returning to neutral or positive would signal U.S. institutional demand resumption.
The wildcard nobody is modeling: a sudden escalation in the Iran-Israel-U.S. conflict that sends oil above $120. At those prices, the macro damage to risk assets would be severe and fast. Crypto has proven resilient to geopolitical shocks before - but it has never been tested in an environment where oil simultaneously cripples equity markets, pushes inflation well above target, and locks the Fed into holding rates at restrictive levels indefinitely. That scenario is a 15-20% probability event that could produce 30-40% downside in crypto from current levels.
Thursday's action is not a crisis. It is a stress test. The derivatives market is repricing risk correctly given the macro environment. MARA's BTC sale is a rational capital allocation decision. The CLARITY Act stablecoin drama is being resolved by actual analysis rather than panic. Bitcoin's 50-day consolidation is intact, if barely. The market is doing what markets do when macro headwinds intensify: it is selling first and asking questions later.
For traders, the play is patience. For long-term holders, the 600,000 BTC accumulated at these levels by other long-term holders is a floor that has not been seriously tested yet. For altcoin holders, the message from today's session is simple: thin liquidity plus negative macro is a dangerous combination, and the AI/DeFi narrative premium is the most vulnerable part of the entire market structure. Protect capital first, chase upside later.
Get BLACKWIRE reports first.
Breaking news, investigations, and analysis - straight to your phone.
Join @blackwirenews on Telegram