The Rate Hike Ghost: How 178k Jobs, $109 Oil, and an ISM Shock Killed Bitcoin's Best Hope
The macro setup traders were counting on - rate cuts by summer, falling oil, easing inflation - just got torched. One Friday morning obliterated six months of positioning. Bitcoin is stuck at $67k and the question now isn't when rates fall. It's whether they rise.

Market data screens showing volatility as the March jobs report hit. Photo: Pexels
The number that landed on Friday morning was not supposed to happen. The consensus was 60,000 jobs. The actual print was 178,000. That is not a beat - it is a demolition of expectations, a statistical gut-punch that rewrote the rate outlook in the span of sixty seconds.
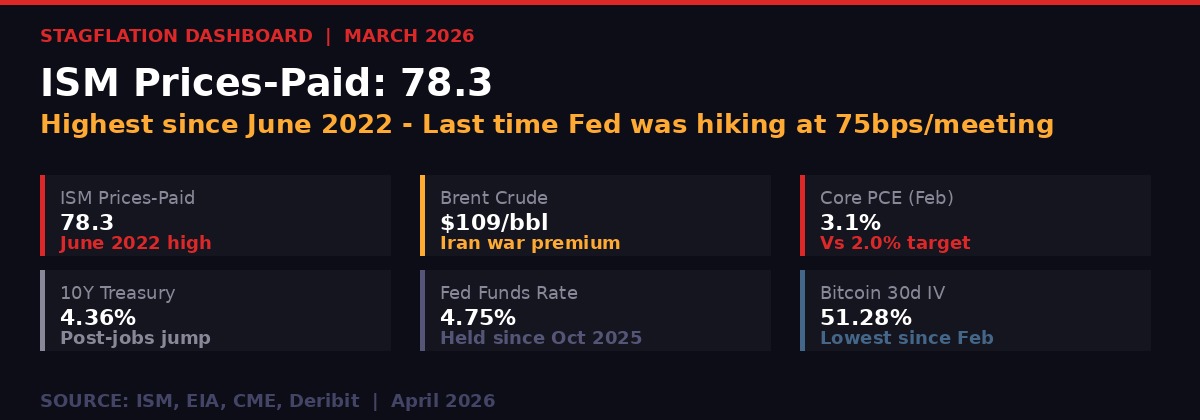
And it did not arrive alone. Behind it came an ISM Manufacturing Prices-Paid reading of 78.3 - the highest since June 2022, the same month the Federal Reserve was hiking rates by 75 basis points at a single meeting. Behind that came Brent crude locked at $109 a barrel, an Iran war premium that has refused to budge despite every ceasefire rumor and every diplomatic murmur out of Washington since March. And behind all of it sat a 10-year Treasury yield that jumped four basis points to 4.36% inside minutes of the BLS release, telling anyone still watching that the bond market does not buy the "temporary oil shock" narrative the Fed has been carefully constructing.
Bitcoin sat at $67,000 when the data hit. It stayed at $67,000 after. That stillness is the story. Not a crash - a trap. The market is not panicking. It is frozen, hostage to a macro environment that has no clean resolution, where every piece of good economic news is actually bad news for risk assets because it delays the one thing - rate cuts - that the entire $67k support structure is built on.
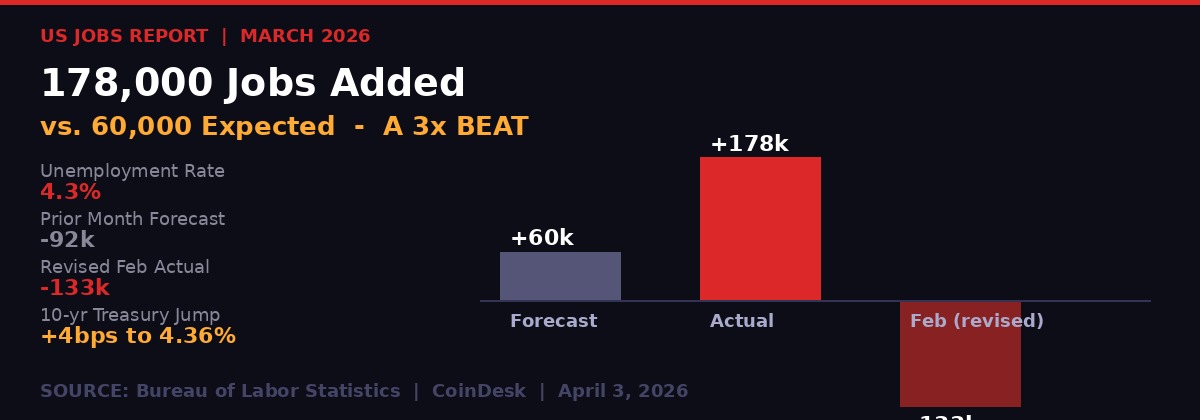
March 2026 jobs report: 178k actual vs 60k forecast, a 3x beat. Unemployment fell to 4.3%. Source: Bureau of Labor Statistics
The Numbers That Broke the Rate-Cut Thesis
Start with the jobs report. The Bureau of Labor Statistics released March payroll data on April 3, showing the US economy added 178,000 positions - nearly three times the economist consensus of 60,000. (Source: BLS, CoinDesk, April 3, 2026) The unemployment rate ticked down to 4.3% from 4.4%, defying expectations for it to hold flat.
Context matters here. February was a disaster - the economy shed 133,000 jobs in a month when the Iran war premium was crushing business confidence and energy costs were eating into margins. The original February print was -92,000; the BLS revised it down further to -133,000, meaning the rebound looks even stronger in relative terms. March wiped out February's losses and then some.
"Expectations about the future course of interest rates, of late, have been far more influenced by events in the Middle East and the price of crude oil than by the outlook for domestic economic growth." - CoinDesk, April 3, 2026
For most of the past two months, the market story was simple: oil is high, growth is suffering, the Fed will eventually cut. That story is now complicated. A rebounding labor market alongside persistently elevated inflation gives the Fed every reason to hold rates higher for longer - and no political cover for a pivot.
The Fed's Chair Jerome Powell had tried to give himself rhetorical cover earlier in the week, stating the central bank "recognized that oil price shocks - while initially making headline inflation numbers look worse - can depress economic activity" and indicating no hurry to raise rates over short-term crude moves. (Source: CoinDesk, April 3, 2026)
That framing was designed for a fragile economy. It does not map onto an economy adding 178,000 jobs in a month when most analysts expected a fraction of that. Powell just lost his best justification for holding still. The jobs market is not depressed. It is accelerating.

The Federal Reserve faces a narrowing path as strong jobs data collides with 4-year inflation highs. Photo: Pexels
ISM 78.3: The Inflation Number Everyone Missed
The jobs headline grabbed the attention. The ISM Prices-Paid reading should have scared more people.
The Institute for Supply Management's manufacturing survey - specifically the prices-paid component, which measures what manufacturers are paying for inputs - came in at 78.3 for March. Any reading above 50 indicates expansion. Anything above 65 is historically associated with building inflationary pressure. At 78.3, it is the highest reading since June 2022. (Source: ISM, cited in CoinDesk/Enflux, April 2026)
June 2022 was when the Federal Reserve delivered its first 75-basis-point rate hike in a single meeting. The Fed Funds rate went from near-zero to 4.75% in the twelve months that followed. That is the historical context sitting behind today's ISM print.
The mechanism is straightforward. Manufacturers are paying more for inputs - steel, semiconductors, chemicals, energy. Those input costs flow through to consumer prices in the Producer Price Index and eventually into the PCE deflator, the Fed's preferred inflation gauge. February's core PCE came in at 3.1% - already 110 basis points above the 2% target. If March mirrors the ISM print, April 9's PCE release could show it climbing.
Key macro indicators as of April 2026. ISM prices-paid at 78.3 - first time this high since June 2022. Source: ISM, EIA, CME
Enflux, a Singapore-based market maker, flagged the dynamic in a note to CoinDesk. "The price floor is partly underwritten by rate-cut expectations," they wrote, describing how Bitcoin's $65,000 support has been anchored not by genuine spot demand but by macro positioning. When those rate-cut expectations begin to unravel, the floor moves with them.
The Enflux note also highlighted the concrete evidence of that unraveling: "$296 million in net ETF outflows during the week of March 24 and muted inflows in early April." (Source: Enflux/CoinDesk, April 3, 2026) ETF flows are the cleanest proxy for institutional sentiment. They were negative before the jobs print. They are not going to improve after it.
"The ISM prices-paid index jumped to 78.3 in March, its highest since June 2022, undermining expectations for near-term rate cuts." - Enflux, cited in CoinDesk, April 3, 2026

Brent crude at $109/barrel reflects Iran war supply disruptions. Energy inflation feeds directly into ISM prices-paid. Photo: Pexels
$109 Brent: The Oil Premium That Will Not Quit
Crude oil is sitting at $109 per barrel as of this writing. That number has barely moved despite weeks of diplomatic noise around potential Iran ceasefire talks. When Trump suggested a possible end to the war on a Monday, markets rallied 4%. By Wednesday he had promised to hit Iran "extremely hard." The oil market shrugged at both - Brent barely blinked. (Source: CoinDesk, April 3, 2026)
That is what happens when physical supply disruptions are real and not merely theoretical. The Iran war has materially impacted Gulf shipping routes. The Strait of Hormuz - through which roughly 21% of global oil flows on any given day - has been operating under extraordinary stress. Insurance costs for tankers have surged. Routing has changed. The BBC reported on April 4 that a French-owned ship appeared to be the first vessel from a major European firm to transit the strait since the conflict began - underscoring just how long the disruption has been running. (Source: BBC, April 4, 2026)
Asia feels this most acutely. South Korea, Japan, and India are the largest non-China importers of Gulf crude, and all three are watching inflation accelerate as energy import costs climb. The BBC separately reported that "shortages and higher prices are starting to bite" across Asian economies reliant on Gulf oil. (Source: BBC, April 3, 2026)
Dubai's tourism sector has experienced what operators are calling a "brutal" collapse in visitor numbers - a tell that the war's economic footprint extends far beyond the energy market. (Source: BBC Worklife, March 2026)
The Powell speech attempted to draw a line around oil: higher crude is a supply shock that the central bank should look through rather than react to. That argument has historical precedent - the 1970s stagflation was worsened by an overly aggressive Fed response to oil shocks. But the 2022 experience cut the other way. The Fed waited too long, then had to hike aggressively, and still managed to bring inflation down without a recession. The institutional memory from that episode argues for earlier action, not later.
When oil stays at $109 AND jobs surge AND ISM prices-paid hit 78.3 in the same month, the "look through the oil shock" argument starts to look like wishful thinking. These are not independent forces. They are compounding.
Bitcoin's Structural Problem: Priced on Rate Expectations, Not Fundamentals
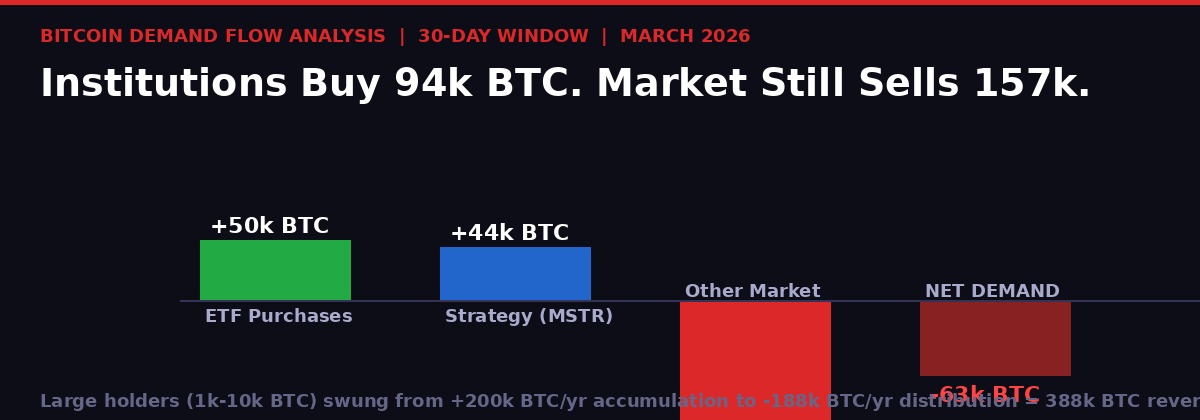
Bitcoin demand flow breakdown - March 2026. Institutional buying is accelerating but being overwhelmed by broader market distribution. Source: CryptoQuant
There is a structural story beneath the macro noise that matters more than any single data point. Bitcoin's market is emptying out from the inside, and the institutions filling the gap are not doing it because they believe in the fundamentals - they are doing it because they believe in the macro thesis. And that thesis just got shakier.
CryptoQuant's latest weekly report is brutal in its clarity. Overall 30-day apparent demand is running at negative 63,000 BTC as of late March. The two largest institutional buyers - ETFs and Strategy (formerly MicroStrategy) - absorbed approximately 94,000 BTC between them. ETF purchases hit roughly 50,000 BTC over the rolling 30-day window, the highest since October 2025. Strategy accumulated about 44,000 BTC. (Source: CryptoQuant, cited in CoinDesk, April 3-4, 2026)
Do the arithmetic. Institutions bought 94,000 BTC. Net demand is -63,000 BTC. Therefore, everyone else - retail, older whales, miners, offshore funds, OTC desks - sold roughly 157,000 BTC in the same period.
That is a structural demand deficit that institutional buying is masking rather than solving. It gets worse when you look at who the sellers are. Large holders - wallets with between 1,000 and 10,000 BTC - have flipped from the most aggressive accumulators to the most aggressive distributors on record. Eighteen months ago, these wallets were adding 200,000 BTC to their holdings per year. Today they are removing 188,000. That is a nearly 400,000 BTC swing in positioning from a cohort that historically has been the most reliable long-term demand signal in the market. (Source: CryptoQuant/CoinDesk, April 3-4, 2026)
The Coinbase Premium Index - which measures whether Bitcoin trades at a premium or discount on Coinbase relative to other exchanges, serving as a proxy for US institutional appetite - has been persistently negative since Bitcoin's all-time high above $126,000 in early October 2025. Even in the $65,000-$70,000 range, American buyers have not returned at scale.
"The most visible bitcoin buyers in the world are buying at near-record pace. It is not enough." - CoinDesk, April 4, 2026
The Fear and Greed Index sits between 8 and 14 - deep in extreme fear territory. That it coexists with over $1 billion in net ETF inflows during March tells you something important: the institutions are buying into a market the rest of the participants want nothing to do with. That divergence has to resolve. It usually does when the institutional thesis breaks.
The Gamma Trap Below $68,000 - and Why Holiday Liquidity Makes It Worse
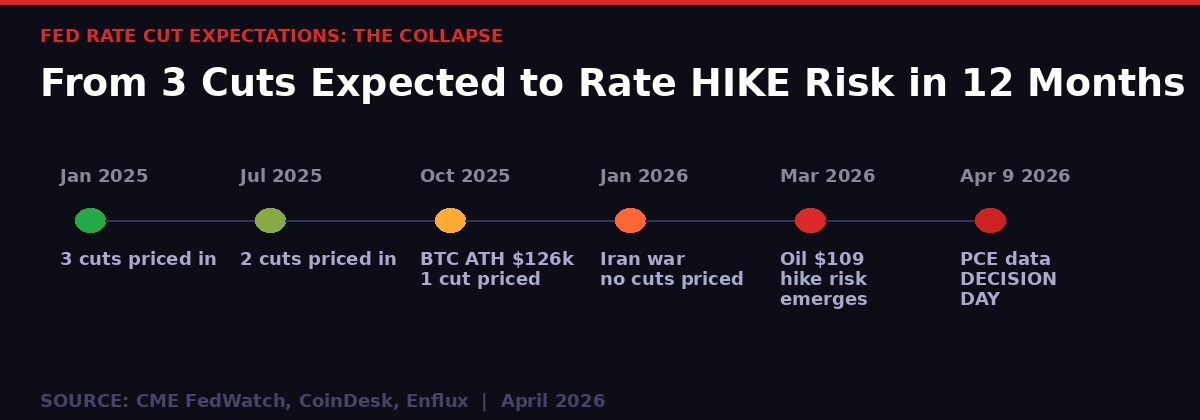
The collapse of rate-cut expectations over 15 months. The pivot thesis is now inverted into potential rate hike territory. Source: CME FedWatch, CoinDesk
The derivatives market has been sending a warning signal for weeks that the spot price has been ignoring. Glassnode's dealer gamma exposure data shows that below $68,000, the gamma profile is almost entirely negative - all the way down to $50,000. (Source: Glassnode, cited in CoinDesk, April 2, 2026)
Here is what that means in practice. Traders have been loading up on put options at strike levels from $68,000 down to the mid-$55,000 range, buying downside protection against the macro risks - the Iran war, quantum computing threats, the bear market that has ground on since last October. When traders buy puts, market makers take the other side and are left holding short put positions.
As the market falls below $68,000, those market makers face losses on their short puts. To hedge, they have to short BTC in spot and futures markets. That hedging pressure pushes prices lower, which triggers more hedging, which pushes prices lower - a self-reinforcing feedback loop known as negative gamma acceleration.
"Negative gamma is now building just below current price levels, from $68K all the way down to the high 50s. A move into this zone could trigger accelerated selling as hedging flows reinforce downside momentum, turning what would otherwise be a gradual move into a sharper repricing, with a potential revisit of the $60k level." - Glassnode Weekly Report, April 2026
Bitcoin was trading at $66,600 as of April 3, already inside the negative gamma zone. The Easter holiday weekend removes the market's primary stabilizers precisely when the structure is most fragile. CME futures close for Good Friday. ETF creation and redemption pauses. The institutional bid that has been anchoring prices goes offline for 72+ hours. (Source: CoinDesk, April 3, 2026)
What remains is the spot market - exactly where CryptoQuant's data shows selling pressure has been most persistent. An extended weekend with no institutional bid, no CME hedging flow, and a macroeconomic backdrop that just delivered three simultaneous inflation signals is the worst possible setup for a market sitting inside a negative gamma zone.
Glassnode puts the potential downside at "a potential revisit of the $60k level, the bottom of the February 5 selloff." CoinDesk's analysis goes further - if the feedback loop fully kicks in, the decline could extend well below $60,000. The prior cycle low comparables show that when Bitcoin breaks below realized price, the deepest drawdowns have reached 15% below that level. Realized price today is $54,286. That math points toward $46,000 in the worst-case scenario.
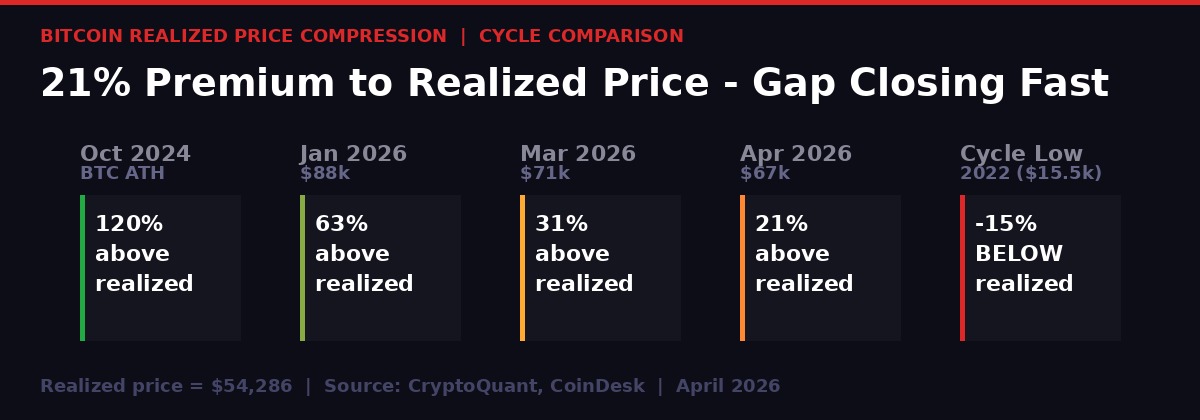
Bitcoin's premium to realized price compressing from 120% at the October 2024 ATH to just 21% today. Source: CryptoQuant
Kwarteng, Stack BTC, and the Political Signal You Should Not Ignore
While the macro data was landing, a quieter story broke on April 4 that deserves more attention than it got. Kwasi Kwarteng - the UK's former Chancellor of the Exchequer, who served just weeks in office in September 2022 before triggering a Gilt crisis that exposed the pension system's Liability-Driven Investment implosion - publicly aligned himself with bitcoin as "an alternative to failing systems." (Source: CoinDesk, April 4, 2026)
Kwarteng is now executive chairman of Stack BTC (STAK), a UK-listed bitcoin treasury company holding 31 BTC on its balance sheet. The firm has attracted high-profile political interest: Reform UK leader Nigel Farage took a 6% stake in the company in March. (Source: CoinDesk, April 4, 2026)
The significance is not the 31 BTC. It is the signal. A former G7 finance minister is publicly endorsing bitcoin as a hedge against what he calls the UK's fiscal "doom loop" - a state where government is "spending more money than you can raise in taxation" and tax hikes "kill incentives in the economy." His critique of short-termism - "everything's quarterly driven, people are either euphoric or freaking out" - lands with particular force in a week when a single jobs print sent Treasury yields spiking and rate expectations into whiplash.
"The Treasury, the Bank of England are certainly aware of bitcoin and digital assets, but it's still incredibly small." - Kwasi Kwarteng, Former UK Chancellor, CoinDesk interview, April 4, 2026
What Kwarteng is doing - consciously or not - is establishing the long-side narrative. If the macro environment continues to deteriorate, if the Iran war drags on, if rate hikes materialize, the argument for holding sovereign fiat becomes harder to make. The UK's fiscal position is not uniquely dire - the US is running a $1.5 trillion wartime budget, France is facing political instability, Germany is mobilizing for conscription. The sovereign stress story that underpins every serious Bitcoin bull thesis is getting stronger, not weaker.
The problem is timing. That long-term thesis plays out over years. The negative gamma trap, the holiday liquidity gap, and April 9's PCE data play out over days. Kwarteng can be right about the decade while Bitcoin falls 20% in the next two weeks.
April 9: The PCE Number That Decides Everything

April 9's core PCE release is the next major catalyst. A print above 3.1% could trigger rate hike repricing that collapses Bitcoin's support structure. Photo: Pexels
The next hard data point is April 9: US core PCE inflation. February came in at 3.1%. The March ISM reading of 78.3 - factoring in that manufacturers' input cost pressures take roughly 6-8 weeks to flow through to consumer prices - suggests the March PCE could match or exceed February's reading. (Source: ISM, CoinDesk/Enflux analysis, April 3, 2026)
If March core PCE exceeds 3.1%, several things happen simultaneously. CME FedWatch will likely shift to pricing a higher probability of a 2026 rate hike - the first hike talk since October 2024. Even a shift from "hold" to "hike possible" in the derivatives market reprices risk assets meaningfully. The Enflux-identified support level - Bitcoin's price floor "partly underwritten by rate-cut expectations" - loses its foundational argument. ETF flows face their own pressure as pension funds and wealth managers reassess risk-asset allocations in a hiking cycle.
CryptoQuant identifies the resistance band for any relief rally at $71,500-$81,200 - the levels that have capped rebounds in the current bear-market structure. Getting through $68,000 on the upside requires institutional conviction that is not currently visible in the Coinbase Premium or the Glassnode demand data. Getting pushed below $65,000 on the downside has a clear mechanical path via the negative gamma cascade.
The asymmetry is ugly. The upside requires macro improvement that is not in sight. The downside has a self-executing mechanism waiting below the current price.
Timeline: How We Got Here
Bitcoin hits all-time high of $126,000. Rate-cut cycle is underway - three cuts priced for 2025. Risk-on sentiment at multi-year highs. Large holders accumulating at +200,000 BTC/year pace.
Bear market begins from ATH as the rate-cut pace disappoints. Bitcoin grinds lower through $100k, $88k. Whale distribution begins. The premium to realized price starts compressing from 120%.
Brent crude stabilizes above $105. Bitcoin range-trades $65k-$73k. No direction. ETF inflows running at 50,000 BTC/month but market-wide demand still negative. Large holders now distributing -188,000 BTC/year - a 388,000 BTC swing from accumulation.
$296 million in net ETF outflows in a single week - the largest weekly outflow in months. ISM prices-paid data begins circulating ahead of official release. Realized price compresses to $54,286, leaving only a 21% premium.
Bitcoin breaks below $68,000 - into the negative gamma zone Glassnode had flagged weeks earlier. BLS releases March jobs: 178,000 vs 60,000 expected. 10Y Treasury jumps to 4.36%. CME closes for Good Friday, removing institutional bid for 72+ hours. ISM prices-paid confirmed at 78.3.
Bitcoin trading on spot-only liquidity with no CME bid and no ETF flow. Sitting at approximately $66,600-$67,000. The setup heading into Easter is the most fragile since February's selloff to $60,000.
Core PCE data release. The number that determines whether the rate hike ghost materializes into actual policy. The entire market is waiting for this print. A beat means the thesis that held $67k breaks.
Three Scenarios: What Happens After Easter

Traders are positioned for a binary outcome around April 9's PCE release. The negative gamma setup makes a sharp move in either direction most likely. Photo: Pexels
Scenario A: PCE Misses to the Downside (Below 3.0%)
If March core PCE comes in below February's 3.1%, the rate hike narrative deflates. Ceasefire signals from Iran could compound the relief rally. Bitcoin has a clear path toward the $71,500 resistance level CryptoQuant identified. Probability estimate from current market structure: low but non-zero. This requires oil prices to have stopped transmitting to consumer prices, which is possible given supply chain lags but not the base case given ISM at 78.3.
Scenario B: PCE In-Line (3.0-3.2%)
Uncertainty continues. Bitcoin stays range-bound between $65,000 and $71,500. Rate hike pricing stays contained but doesn't disappear. Institutional flows remain muted. The market waits for the next catalyst - probably May FOMC or a major escalation/de-escalation in Iran. This keeps the negative gamma trap armed without pulling the trigger.
Scenario C: PCE Beats Upside (Above 3.2%)
CME FedWatch starts pricing rate hike probability at a level that moves markets. ETF inflows reverse sharply. The Enflux support floor dissolves. Bitcoin tests $65,000 and - given the mechanical setup below $68,000 - the gamma cascade the Glassnode report warned about becomes real. First stop: $60,000. Second stop, if momentum builds: low $50s. CryptoQuant's realized price at $54,286 becomes a target rather than a floor. This is the scenario the put options were written for.
The market is currently priced for Scenario B with a fat tail toward Scenario C. ISM prices-paid at 78.3 argues strongly for Scenario C. The holiday liquidity gap increases the magnitude of whichever direction the market moves. Small, contained moves are unlikely this week.
The rate hike ghost was supposed to have been exorcised in 2023. It was banished for most of 2024. It came back last week with a 178,000-job sledgehammer, a decade-high inflation input reading, and crude oil that simply will not come off the boil. Bitcoin built its entire support structure on the assumption that the Fed was done tightening and that gravity would eventually point toward easier money. That assumption is now seriously in doubt.
The institutions are buying. The whales are selling. The options structure favors the downside. The macro data favors the bears. And the market has a four-day holiday to sit with all of it before PCE on April 9 forces a resolution.
At $67,000, Bitcoin is not cheap. It is not expensive. It is exposed.
Get BLACKWIRE reports first.
Breaking news, investigations, and analysis - straight to your phone.
Join @blackwirenews on TelegramSOURCES
- Bureau of Labor Statistics - March 2026 Employment Situation Summary, April 3, 2026
- CoinDesk - "U.S. March jobs smash expectations, with 178,000 added," April 3, 2026
- CoinDesk - "Here's why bitcoin's drop below $68,000 raises the risk of a crash under $60,000," April 2, 2026
- CoinDesk - "Bitcoin heads into holiday weekend exposed as ETF and CME flows go offline," April 3, 2026
- CoinDesk - "Five data sources say the same thing about bitcoin market. It's thinning from the inside," April 3-4, 2026
- CoinDesk - "Crypto consolidates as volatility cools and futures markets tilt bearish," April 3, 2026
- CoinDesk - "Ex-UK Chancellor backs bitcoin as alternative to failing systems," April 4, 2026
- CryptoQuant Weekly Report - Bitcoin demand and whale distribution data, March-April 2026
- Glassnode Weekly Report - Dealer gamma exposure and options structure data, April 2026
- Enflux Market Note - Rate-cut expectations and Bitcoin floor analysis, April 3, 2026
- ISM Manufacturing Survey - Prices-Paid Index, March 2026
- BBC News - "US jobs surge unexpectedly in March despite Iran war," April 3, 2026
- BBC News - "From South Korea to Sri Lanka, how the Iran war is impacting Asia," April 3, 2026
- BBC News - "French-owned ship passes through Strait of Hormuz," April 4, 2026
- BBC Worklife - "Dubai's tourism sector reels from 'brutal' impact of war," March 2026