The Stagflation Trap: Fed Hike Bets Hit 60%, Bitcoin Bleeds to $68K, and Markets Have No Exit
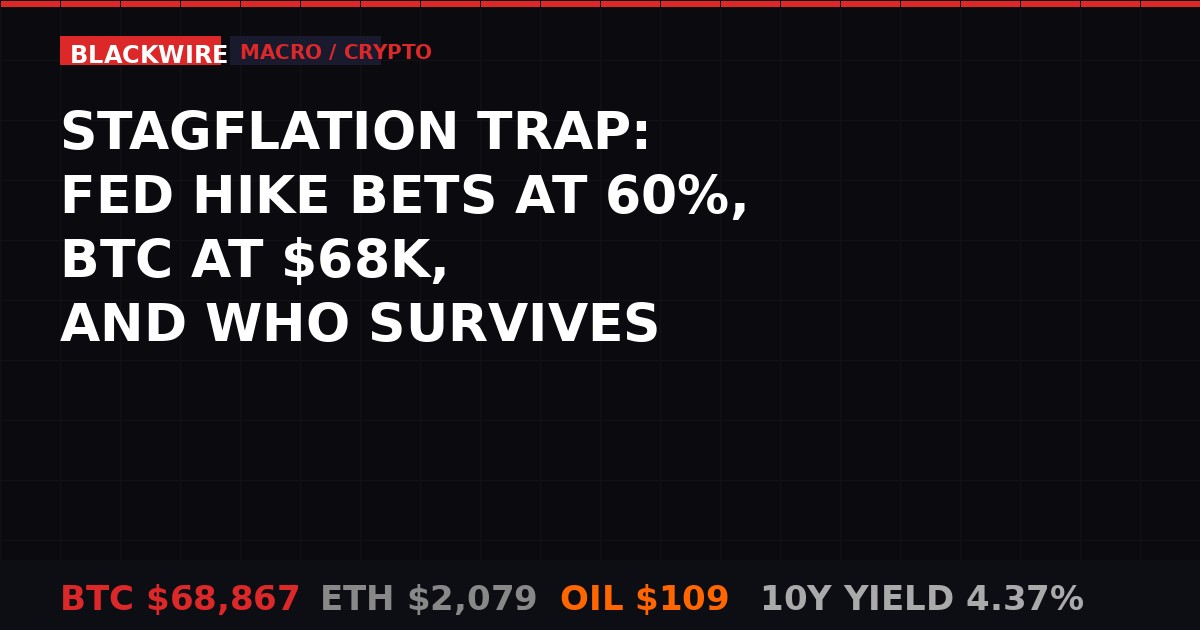
The worst macro backdrop for crypto in years. BTC at $68,867, Brent crude at $109, and rate hike bets surging. / BLACKWIRE
Three months ago, traders were arguing about which month the Fed would cut. Now they're pricing in rate hikes. Bloomberg-based FedWatch data puts hike odds above 60% by October 2026. That number moved from zero to sixty in about ten days - driven by Brent crude above $109, Middle East escalation threatening the Strait of Hormuz, and inflation data that refuses to die.
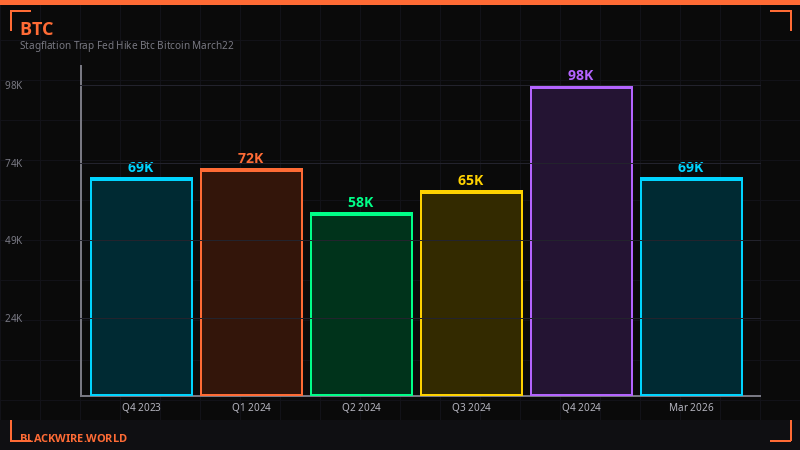
Bitcoin is caught in the crossfire. It closed the week just below $70,000, dropped further to $68,867 on the weekend, and the options market is flashing readings not seen since 2022. This is not a dip. This is a regime shift - and understanding what kind of regime it is matters more right now than checking price levels every fifteen minutes.
The word everyone needs to know for 2026 is stagflation. Elevated inflation. Weakening growth. Policy constraint. The combination that leaves central banks with no clean move and investors with nowhere obvious to hide. Bitcoin was built for exactly this environment in theory. The practice is turning out to be more complicated - and much more interesting to trade.
Rate cut odds at zero for April. Hike bets surging past 60% by October. The Fed's playbook just got rewritten. / BLACKWIRE data visualization
How Rate Hike Bets Went From Zero to 60% in Ten Days
The Federal Reserve held its target range at 3.50%-3.75% on March 18 and delivered exactly what markets expected: no move, careful language, and a nod toward watching oil price pass-through. What happened in the 48 hours after the meeting was the story nobody fully telegraphed.
Bloomberg-based pricing swung from 17% rate cut odds in February to 0% cut probability for April. Then hike bets lit up - 6% for the immediate meeting, accelerating toward 25% for May, 45% for July, and above 60% by the October meeting, according to CryptoSlate reporting citing CME Group's FedWatch tool.
The fuel for that repricing was $109 Brent crude. US crude touched $98 on March 20 as Middle East escalation - specifically the ongoing conflict affecting oil transit routes near the Strait of Hormuz - kept supply disruption risk elevated. The Strait handles roughly 20% of global oil supply, and every percentage point of risk premium on that chokepoint bleeds directly into US gasoline, freight costs, and ultimately the core PCE numbers the Fed watches most carefully.
The EIA's March baseline still assumes Brent eases below $80 by Q3 and ends the year near $70. The market's current bet is that assumption is optimistic to the point of being wrong. And that bet is flowing into rate expectations at speed.
The 10-year Treasury climbed to roughly 4.37%, the 30-year reached its highest level since September 2025, and the S&P 500 headed toward a fourth consecutive weekly loss. Global equity funds shed $20.3 billion in the week through March 18, with US equity funds alone accounting for $24.78 billion of outflows, per flow data cited by CryptoSlate. Money market funds absorbed $32.57 billion globally in the same period.
Cash, yielding close to 4%, is pulling capital out of risk assets in real time. That is the mechanical reality underneath every crypto price conversation right now.
Fed Chair Jerome Powell said at the March meeting the central bank is watching whether higher fuel and input costs leak into core PCE inflation. If core PCE drifts above 3.2% - Bank of America's cited threshold for a credible hike case - alongside unemployment holding near 4.5% and oil in the $80-$100+ range, the Fed faces a genuine policy trap: inflation is too sticky to cut, growth is too fragile for aggressive hiking. Welcome to stagflation.

The entire top-10 is bleeding. ARB leads losers at -6%. Even TRON's small green print cannot mask the sector-wide pressure. / BLACKWIRE
What Stagflation Actually Means - And Why Bitcoin Is Caught in the Middle
Stagflation is three conditions arriving together: elevated inflation, weak growth, and a labor market losing force. Add a fourth condition - policy constraint, where the central bank cannot ease aggressively because inflation is still too high - and you have the full regime. The formal definition captures something that millions of households have been living through since 2020 without having a clean word for it.
The US is approaching confirmation. February CPI rose 0.3% month-over-month and 2.4% year-over-year. Core CPI was 2.5% on the year. Those readings do not signal a crisis - but they also provide no basis for an all-clear. The CPI index stood at 258.678 in February 2020 and 326.785 in February 2026 - a cumulative rise of roughly 26%. Inflation slowing from its 2022 peak never meant prices returned to prior levels. It meant the rate of increase moderated.
January PCE rose 2.8% year-over-year, with core PCE running at 3.1%. Producer prices are hotter still: February final-demand PPI climbed 0.7% on the month and 3.4% on the year - the largest 12-month increase since February 2025. Consumer-facing numbers are cooler than the production pipeline. That gap can close fast if a new cost shock arrives before disinflation completes its work. Oil at $109 is exactly the kind of shock that closes it.
For Bitcoin, this creates a specific contradiction that the inflation-hedge narrative has not fully answered. The pitch works when rising prices signal debasement fears and easier money ahead. It runs into trouble when inflation signals oil up, yields up, dollar firmer, and the Fed unable to ease. An IMF working paper found that a single crypto factor explains 80% of variation in crypto prices, and that Fed tightening reduces that factor through a risk-taking channel.
"Bitcoin's buoyancy in January reflected, in part, CLARITY Act optimism - and that optimism coincided with a swing from $1.3 billion of ETP outflows in the prior 30-day period to $440 million of inflows." - VanEck January Bitcoin ChainCheck, cited CryptoSlate
Bitcoin fell roughly 50% from its October 2025 highs through February 2026, as tech stocks sold off and institutional capital rotated out of growth assets. The BIS described this in its most recent quarterly review. As more professional capital entered crypto, Bitcoin's correlation with equities rose. The very success of the ETF era - bringing in institutional money - also brought in institutional selling behavior.
The stagflation dashboard: US and UK macro conditions in one frame. Almost every indicator is flashing warning. / BLACKWIRE
Bitcoin ETF Flows: The Money Speaks Louder Than the Narrative
Spot Bitcoin ETF flows are the real-time verdict on whether institutional money believes the inflation-hedge story is working. The data from Farside Investors is blunt.
March 17 saw $199.4 million in inflows - one of the stronger single-day readings of the month. Then March 18 and 19 combined for $253.7 million in outflows. The same two-day window that repriced Fed policy from neutral to hawkish drained more from Bitcoin ETFs than the prior session brought in.
The pattern is consistent with what an IMF working paper described as the "risk-taking channel" of Fed policy: tighter financial conditions reduce the single common factor that drives crypto prices, regardless of the specific inflation narrative investors tell themselves.
Citi cut its 12-month Bitcoin target from $143,000 to $112,000, citing stalled US legislation and tighter macro. Its bull case is $165,000 (if the Fed resumes easing). Its recessionary bear case is $58,000. The spread between those numbers - $107,000 - tells you the range of outcomes the smartest institutional desks are carrying in their models right now.
JPMorgan told clients in February that crypto markets could get a meaningful lift in H2 2026 if market structure legislation passes by midyear. That framing treats Senate calendar risk as a second-half price catalyst. The bank was telling clients to watch Politico alongside CME FedWatch for Bitcoin's next move.
The Coinbase and EY-Parthenon survey of 351 institutional investors in March confirmed the picture: institutions are not retreating from crypto, but they are demanding better conditions before deploying more capital. Regulatory certainty, tighter spreads on ETF products, and macro tailwinds are the three gating factors cited repeatedly. Right now, all three are working against new positions.

ETF flows turned sharply negative after the March 18 Fed decision repriced hike bets. Institutional hands moved fast. / BLACKWIRE / Farside Investors
UK Bond Panic: Britain's Fiscal Stress Adds Another Layer
The stagflation problem is not confined to the US. Britain is running its own version, and the numbers are uglier in some respects because the UK has less fiscal room to absorb shocks.
Official ONS borrowing data showed February public sector net borrowing hit £14.3 billion - up £2.2 billion from a year earlier and the second-highest February reading since records began in 1993. Public sector net debt stood at £2.88 trillion, or 93.1% of GDP. On the same day, the Bank of England held the Bank Rate at 3.75% and warned that the latest energy shock would push inflation back above 3% in the near term.
The Bank of England's March minutes put CPI inflation at 3% to 3.5% over the next couple of quarters - driven by household energy bills set to jump as the Ofgem price cap resets upward. UK gas futures implied the next cap could rise by 35% to 40% from current levels.
Meanwhile, the average rate on household instant-access deposits in the UK sits at 2.02%, according to Bank of England data. Easy-access cash is paying roughly 1 to 1.5 percentage points below the Bank's own near-term inflation forecast. That gap is the exact arithmetic that leads savers to start looking at alternatives.
"Britain does not need a rush into Bitcoin for the asset to enter the conversation in a new way. A fresh round of doubt about cash, government bonds, and delayed rate cuts is enough to change how savers rank risk." - CryptoSlate analysis, March 21, 2026
Roughly 1.8 million fixed-rate mortgages will expire in the UK during 2026, according to UK Finance forecasts. Each reset moves a household from a rate locked in during the low-rate era to whatever the current market offers. The ONS household costs index showed inflation running at 3.6% for all households and 3.7% for mortgagors in Q4 2025 - before the Bank's latest warning about energy pushing costs higher again.
The UK sequence runs: government borrowing rises, gilt yields reprice, mortgages reset, household budgets compress, real purchasing power falls while nominal prices stay elevated. That is stagflation at the kitchen table. Bitcoin gains relevance in that setting not because of ideology but because of arithmetic - an asset outside the sovereign stack becomes more interesting when the sovereign stack is visibly stretched.
| UK Indicator | Latest | Signal |
|---|---|---|
| February Public Borrowing | £14.3 billion | 2nd highest Feb since 1993 |
| Public Debt / GDP | 93.1% | Near record - limits fiscal space |
| Bank Rate | 3.75% | Held - no relief delivered |
| BoE Near-Term CPI View | 3% - 3.5% | Re-acceleration expected |
| Instant-Access Deposit Rate | 2.02% | Below BoE's own inflation forecast |
| Mortgages Resetting in 2026 | 1.8 million | Accelerates household pain |
CLARITY Act: The One Catalyst That Could Break the Cycle
Against the macro headwinds, there is one policy-driven catalyst still capable of repricing crypto higher - and it moved closer to reality this week.
Politico reported that senators and White House advisers reached an agreement in principle on the stablecoin-yield clause that had been blocking the CLARITY Act for months. Senate Banking Chairman Tim Scott credited Senators Angela Alsobrooks, Thom Tillis, and White House adviser Patrick Witt with advancing the negotiations. Tillis said lawmakers were "very close" to a deal on March 18.
The CLARITY Act matters for Bitcoin and the entire sector in ways most retail traders do not fully track. The bill would write permanent federal rules governing how crypto exchanges, brokers, dealers, and custodians operate - and hand the CFTC formal spot-market authority. No SEC guidance, however friendly, can do what legislation does: create rules that survive administrations, lawsuits, and regulatory leadership changes.
The stablecoin-yield clause was the blockage because banks warned that crypto firms offering rewards on stablecoin balances could drain deposits from the traditional system. Standard Chartered estimated stablecoins could drain roughly $500 billion from US bank deposits by end-2028. That framing gave Senate opponents a systemic-risk argument that stalled the bill for nearly two months.
The deal in principle signals that argument has been resolved - or bridged well enough to move forward. But "agreement in principle" is not a vote. The bill still needs at least seven Senate Democrats, faces unresolved disputes over elected officials profiting from crypto ventures, and must reconcile the Senate Banking and Senate Agriculture drafts. Floor time in a congressional calendar that shrinks toward midterms is not guaranteed.
From stall to deal-in-principle: the CLARITY Act's path through Washington. The next gate is Senate floor time. / BLACKWIRE
This week's other regulatory development was the SEC and CFTC joint guidance declaring that most crypto tokens are not securities and creating a taxonomy separating digital commodities, collectibles, payment stablecoins, and digital securities. SEC Chair Paul Atkins said explicitly that the agency now recognizes most crypto assets are not themselves securities - a reversal of years of enforcement-first posture.
The market barely moved. That tells you something important: regulatory goodwill from friendly agencies, in the absence of durable legislation, is no longer enough to rerate the sector. Traders want Congress, not commissioners. Better odds and clear odds are different things - and right now, Congress is the real bottleneck between the current price and any institutional demand surge.
What to watch: April 3 jobs report. April 9 PCE. April 28-29 FOMC. Senate floor schedule for CLARITY. Any of these can reset the macro picture fast - in either direction. Soft jobs + soft PCE = rate hike narrative deflates, Bitcoin liquidity tailwind returns. Sticky PCE + firm labor = hike bets harden, and Citi's $58,000 bear case gets closer to consensus.
The Macro Scenarios: Two Paths, One Decision Point
The next six weeks are binary for Bitcoin at a macro level. The variables are clear. The outcomes are wide.
Bull case: Oil retraces faster than feared as Middle East tensions plateau. Labor softens into the April 3 jobs report. February PCE on April 9 shows no second-round effects bleeding into core above 3.2%. Hike odds fade. Markets reprice back toward neutral or mildly dovish Fed. Bitcoin regains a liquidity tailwind and can trade more on CLARITY Act momentum than on tightening fears. Citi's $112,000 base case comes back into view. One-year inflation swaps hit 3% this week but the five-year forward swap fell to 2.35% - its lowest in nearly a year - suggesting markets still see this as a temporary disruption rather than a regime reset.
Bear case: Oil stays in the $80-$100+ range into summer. Core PCE prints above 3.2%. Unemployment holds near 4.5%, keeping the Fed from any dovish pivot. Hike bets harden into a durable higher-for-longer trade. Bitcoin trades increasingly like a duration-heavy risk asset - the discount rate on speculative holdings climbs, cash at 4% remains more competitive, and institutional flows continue tilting negative. The BIS's description of crypto's recent drawdown - 50% off October 2025 highs amid a broader rotation away from growth assets - extends rather than reverses.
| Scenario | Macro Trigger | Fed Path | BTC Implication |
|---|---|---|---|
| Bull | Oil retraces, PCE soft, labor cools | Hike bets fade, neutral to dovish | Liquidity tailwind, CLARITY catalyst, $90K-$112K in play |
| Base | Oil stable ~$80-90, mixed data | Higher for longer, no moves | Rangebound $65K-$75K, choppy |
| Bear | Oil stays elevated, PCE re-accelerates | Hike bets harden, Oct hike credible | Duration selloff, $58K-$65K range |
The medium-term, longer-horizon case for Bitcoin as a stagflation hedge is actually coherent in the final stage of the regime: when policymakers are constrained, real yields are falling because the Fed cannot tighten enough to kill inflation, and confidence in fiat purchasing power is structurally eroded, scarce non-sovereign assets get bid. The problem is the sequence. In the early phase of a stagflation shock - which is where markets are right now - Bitcoin tends to correlate with equities on the downside before the store-of-value narrative reasserts itself.
The 1970s analogy that everyone reaches for is instructive here. Gold did not immediately surge when Nixon closed the gold window in 1971. It took years of policy failure, dollar devaluation, and energy crises for the monetary metal to find its true floor and then its ceiling. The timeline for Bitcoin's stagflation thesis playing out to its logical conclusion may be measured in quarters or years, not days.
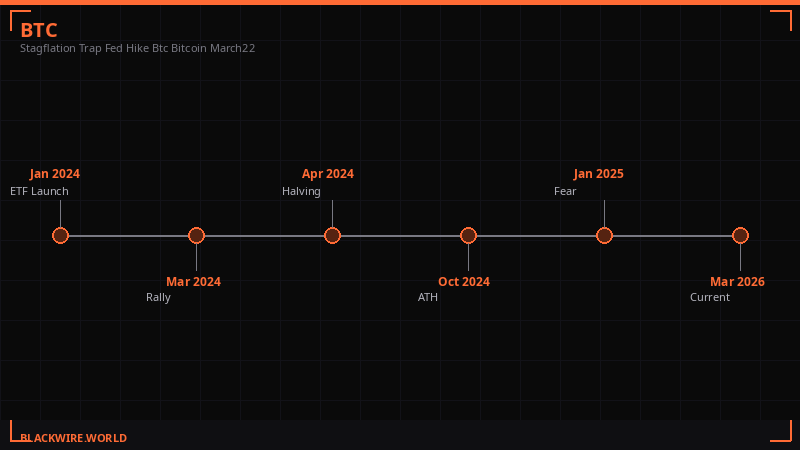
Timeline: The Macro Sequence That Got Us Here
Bitcoin peaks near cycle highs. ETF inflows strong. Fed expectations still pointing toward cuts in early 2026.
Bitcoin falls roughly 50% from October peak. Tech stocks selling off. Institutional correlation forces synchronized drawdown. BIS notes crypto rotation aligns with broader growth-asset exit.
CLARITY Act introduced with stablecoin yield clause. VanEck notes Bitcoin buoyancy tied to legislative optimism. ETF inflows swing from -$1.3B to +$440M as policy sentiment improves. BTC recovers toward $70,000.
Standard Chartered warns stablecoins could drain $500B from US bank deposits by 2028. Senate opponents use systemic-risk argument to stall CLARITY Act. Rate cut odds for April still at 17%. February CPI at 2.4% YoY - below radar, but pipeline PPI already running hot.
SEC and CFTC issue joint guidance: most crypto tokens are not securities. SEC Chair Paul Atkins says no Commission action can future-proof the rulebook like legislation. Market barely responds - traders want Congress, not commissioners. Citi cuts BTC 12-month target from $143K to $112K, citing stalled legislation.
Fed holds at 3.50-3.75%. Brent crude above $109. US crude touches $98. Hike bets begin building. March 18-19 sees $253.7M in combined Bitcoin ETF outflows vs. $199.4M inflows the prior day. Ten-year Treasury hits 4.37%. Politico reports CLARITY Act deal-in-principle on stablecoin yield clause.
Bloomberg-based hike odds climb above 60% for October. S&P posts fourth straight weekly loss. Bitcoin drops to $68,867. Global equity outflows reach $20.3B for the week. UK announces £14.3B February borrowing - second-highest since 1993. Bank of England warns CPI will re-accelerate to 3-3.5%.
Jobs report. PCE. FOMC. The next three macro events that determine whether hike bets harden into a durable trade or deflate as quickly as they built. These dates matter more than any technical level on Bitcoin's chart right now.
What This Means For Crypto Markets Right Now
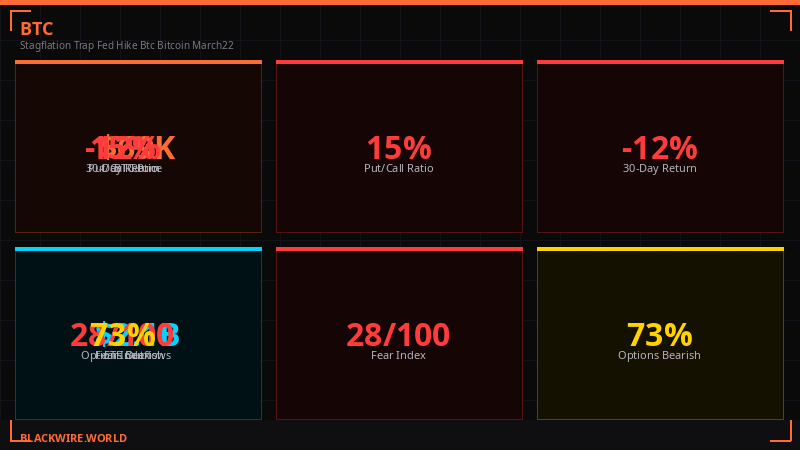
The crypto market's response to this week's events has been efficient - not panic, but disciplined reduction. Volumes are elevated. The put/call ratio on Bitcoin options remains at levels not seen since 2022, reflecting hedging demand from holders who are not selling but are buying insurance. That is not the behavior of a market that believes $58,000 is inevitable - it is the behavior of a market that is taking the possibility seriously.
Ethereum is underperforming Bitcoin at -3.35%, consistent with its historical pattern during macro-driven Bitcoin drawdowns. When crypto sells off on macro grounds rather than sector-specific problems, ETH tends to move faster to the downside because it carries more speculative DeFi and yield-seeking capital that exits faster. At $2,079, ETH is down 0.78% on the seven-day but has held its ground better than the layer-2 tokens - ARB is -7.65% on the week, OP is -7.4%, suggesting capital is concentrating in larger liquid assets rather than spreading across the ecosystem.
The DeXe (DEXE) token is the outlier at +14.52% on the day and +32.17% on the week - a governance protocol for decentralized investment funds. Its move is unrelated to macro and instead reflects specific governance proposal activity. This kind of divergence - one asset disconnecting from the macro selloff - is worth noting because it shows the market is not in full-capitulation mode. Selective bets are still being placed.
The TRUMP memecoin sits at $3.19, down 5.3% on the day and -19.2% on the seven-day. Its continued decline from late-2025 highs reflects both the broader risk-off environment and fading enthusiasm for politically themed tokens as the novelty premium compresses. $741 million market cap for what is functionally a meme is still remarkable, but the direction is clear.
World Liberty Financial (WLFI) at $0.10 with a $2.72 billion market cap and +3.98% on the day is one of the few tokens in green territory - a pattern that has emerged before when the broader market sells off, possibly reflecting political narrative buying rather than fundamental value.
The structural question for the next 60 days is whether the macro headwind intensifies into the April data prints or begins to ease as energy disruption risks moderate. The market is currently pricing a 60% chance the Fed hikes by October. If that probability falls back below 30% - because oil cools, PCE comes in soft, and the jobs market shows clear deterioration - Bitcoin could recover sharply toward $80,000 or higher as the CLARITY Act momentum becomes the dominant narrative again. If those probabilities hold or rise, the path toward $65,000 and lower becomes plausible and well-supported by the same institutional flow mechanics that drove the original decline from October 2025 highs.
The honest answer is that Bitcoin in 2026 is not simple. It is a genuinely complex multi-variable trade requiring a view on oil, the Fed, Congress, and global risk appetite simultaneously. Anyone claiming certainty about the next move in either direction is selling something. The data says watch the April dates. Everything else is noise.
Get BLACKWIRE reports first.
Breaking news, investigations, and analysis - straight to your phone.
Join @blackwirenews on TelegramSources: CryptoSlate, CME FedWatch, Bloomberg-based pricing, BLS (CPI/PPI), BEA (PCE), EIA STEO, ONS (UK borrowing), Bank of England minutes March 2026, Farside Investors, IMF working paper, BIS quarterly review, Politico, Reuters, SEC/CFTC joint guidance, Standard Chartered, VanEck ChainCheck, Citi Research, JPMorgan. Market data current as of March 22, 2026 15:30 UTC.