Saylor's Monopoly: One Man Buying Bitcoin While Everyone Else Quit
Strategy bought 45,000 BTC in the past 30 days - its fastest pace since April 2025. Every other corporate bitcoin buyer on earth combined bought 1,000. The DATCO model isn't struggling. It's dead. And that means bitcoin's price support just narrowed to a single balance sheet.
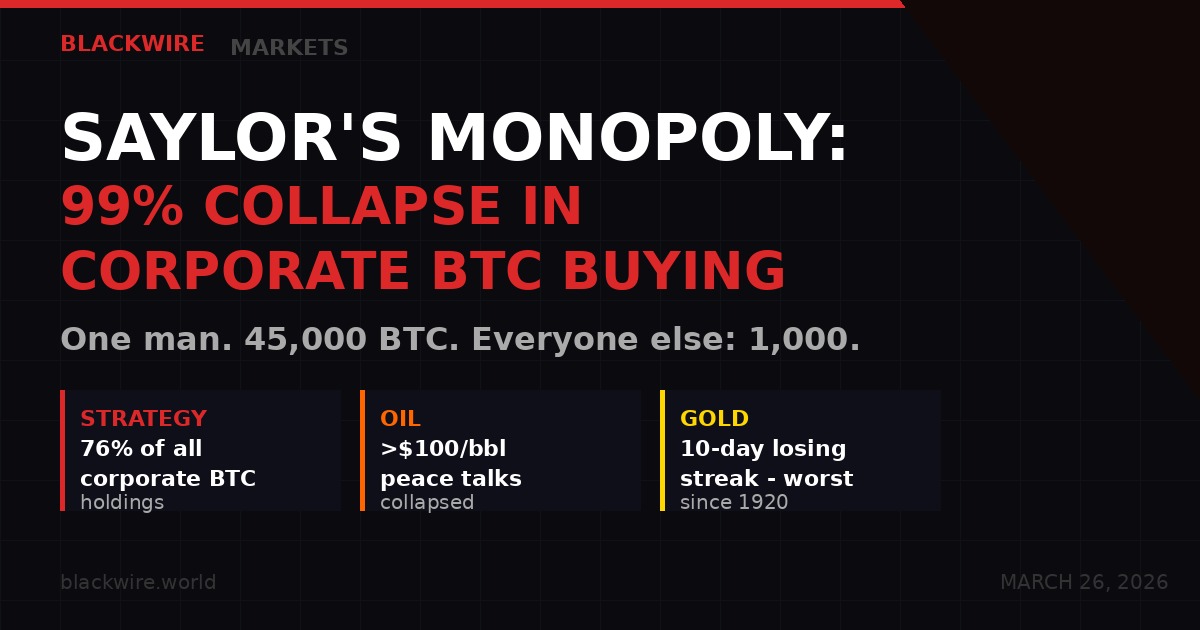
Bitcoin is at $69,400. Oil cracked back above $100 per barrel overnight as U.S.-Iran peace talks collapsed. Nasdaq futures are down 1%. Gold just ended a 10-day losing streak - its worst since 1920. The altcoin market is getting torched. And underneath all of it, a structural story is quietly becoming a crisis.
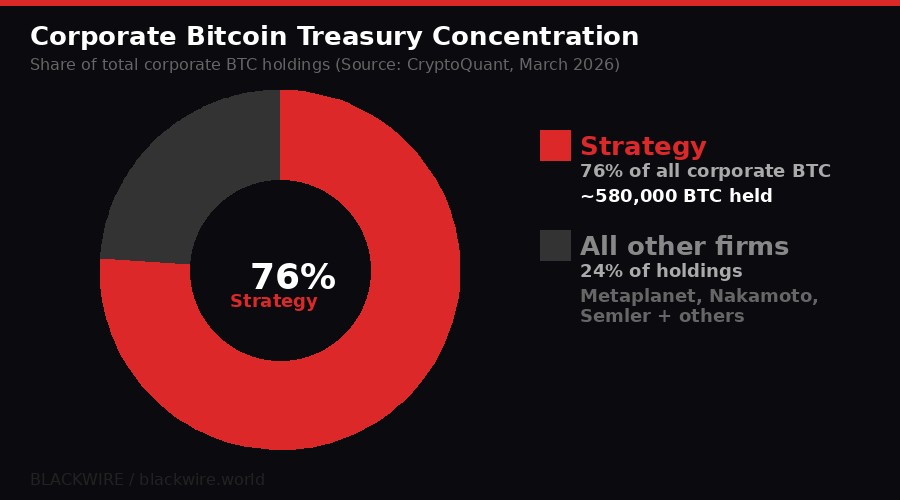
According to a CryptoQuant report published Wednesday, the corporate bitcoin treasury movement has effectively collapsed into a single entity. Michael Saylor's Strategy is now the market. Not metaphorically - literally. It accounts for roughly 99% of all corporate BTC purchases in the past month, and holds approximately 76% of all bitcoin ever accumulated by treasury companies worldwide.
This is not the ecosystem that was promised at Bitcoin Asia in Hong Kong last summer. It's a concentration risk hiding in plain sight.
The DATCO Collapse: From 69,000 BTC to 1,000 BTC
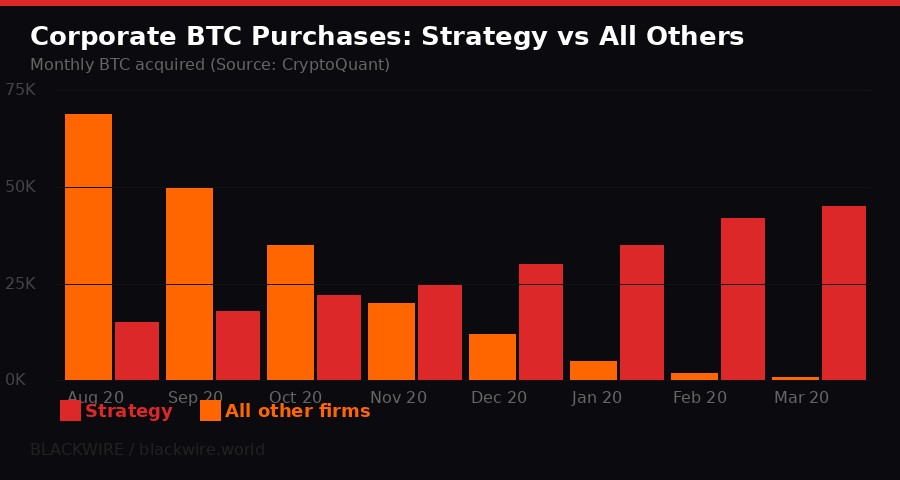
The Digital Asset Treasury Company (DATCO) model had a summer. In July and August 2025, when bitcoin was trading north of $110,000, a wave of companies launched bitcoin treasury strategies in the mold of Strategy's playbook. The logic was simple: issue equity at a premium to net asset value, use the proceeds to buy BTC, let the bitcoin appreciation drive the share price higher, rinse and repeat.
During that peak, all companies outside of Strategy combined were buying approximately 69,000 BTC per month, according to CryptoQuant data. That number represented real diversification of the institutional demand thesis - a sign that the treasury model was scaling beyond one man's conviction.
Eight months later, that number is 1,000 BTC. A 98.6% collapse in participation.
Strategy, by contrast, accelerated. It purchased roughly 45,000 BTC in the past 30 days alone - its fastest pace since April 2025. Combined with prior purchases, the firm now holds approximately 76% of all bitcoin held by treasury companies globally.
Galaxy Digital called this shot in July 2025. In a prescient research report, Galaxy argued that the DATCO flywheel was fundamentally a liquidity derivative - it worked only while equity traded at a premium to underlying bitcoin holdings. Once those premiums compressed, the math would reverse: lower bitcoin prices would shrink net asset values, squeeze equity premiums, and make share issuance dilutive rather than accretive. Source: CoinDesk
That scenario has now played out almost exactly as Galaxy described. Bitcoin peaked above $126,000 in early October 2025, crashed below $60,000 in February 2026, and has been grinding between $65,000 and $75,000 ever since. Companies that bought aggressively near the top - Metaplanet and Nakamoto Holdings carrying average costs above $107,000 per BTC as of December - are deep underwater and have stopped buying.
"The treasury company model was sold as a scalable institutional demand layer for bitcoin. What CryptoQuant's data confirms is that it was, in practice, Strategy's model with imitators. The imitators are gone." - Galaxy Digital July 2025 research, referenced by CoinDesk, March 26, 2026
What Concentration Risk Means in Practice
When the market was promised a broadening institutional base for bitcoin, the implication was resilience. Many buyers, distributed across sectors, geographies, and motivations, create a stable demand floor. If one exits, others remain. The price discovery becomes less dependent on any single actor's decisions.
That is not what the market has today. What it has is one firm with a $1.44 billion cash reserve, a complex capital structure of convertible notes and preferred shares, and a CEO who has staked his professional legacy on the bitcoin price.
Strategy has moved defensively. In December 2025, the company disclosed that $1.44 billion cash reserve with the explicit goal of building it up enough to cover 24 months of dividend and interest obligations. That's insurance against a scenario where bitcoin drops so far that new equity issuance becomes impossible. Source: CoinDesk
But the defensive posture has not slowed its buying. Strategy continues to accumulate at an accelerating rate - 45,000 BTC in a single month. This creates a paradox: the firm is both the largest buyer supporting price, and the single point of failure if its own financial structure comes under stress.
If Strategy were forced to stop buying - by a covenant trigger on its debt, by a collapse in its equity premium, or by a sustained bitcoin bear market that made fresh capital raises impossible - the institutional demand that currently supports bitcoin's $65,000-$75,000 range would disappear overnight.
STRATEGY CONCENTRATION RISK - KEY METRICS (March 2026)
- BTC held by Strategy: ~580,000 BTC (est., based on CryptoQuant 76% share)
- Strategy's 30-day purchases: 45,000 BTC (fastest pace since April 2025)
- All other corporates combined (30 days): ~1,000 BTC
- Other firms' share of purchases: Down from 95% to ~2%
- Strategy cash reserve: $1.44 billion (covering 24 months of obligations)
- Metaplanet/Nakamoto avg cost: >$107,000/BTC as of Dec 2025
- Current BTC price: ~$69,400 (March 26, 2026)
Oil Punches Back Through $100: The Macro Unwind Hits Crypto
Thursday's session is not just a Saylor story. It's a macro event compressing every risk asset simultaneously. Oil cracked back above $100 per barrel after U.S.-Iran peace talks stalled overnight. The breakdown in negotiations reignited risk aversion that had briefly subsided when preliminary dialogue opened earlier this week. Source: CoinDesk
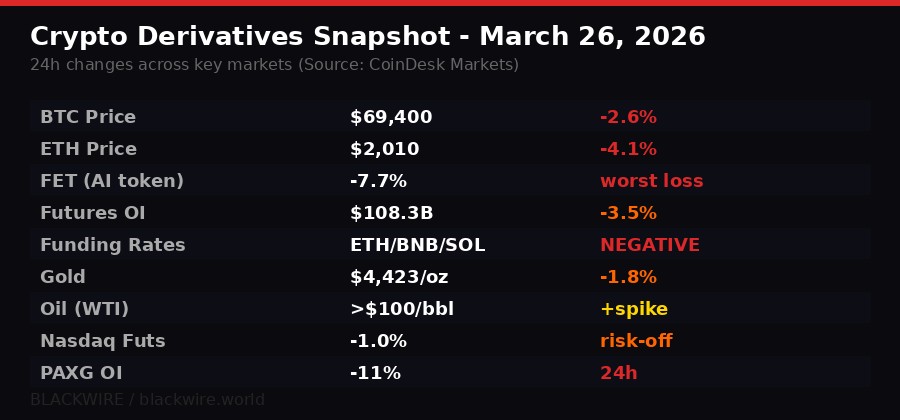
Bitcoin dropped below $70,000 and is trading at $69,400, down 2.6% since midnight UTC. Ether fell toward $2,000, down 4.1%. Nasdaq 100 futures are off about 1%. Gold, after its brutal 10-day losing streak, slid another 1.8% to $4,423 per ounce before finding support.
The altcoin market absorbed the worst of it. The CoinDesk Computing Select Index - which tracks AI infrastructure tokens - fell 4.3% during the Asia session. The DeFi Select Index dropped 3.9%. Individual token damage is severe: FET (Fetch.AI) down 7.7%, ETHFI down 6.3%, RENDER down 5.9%.
In derivatives, the numbers tell a clear risk-off story. Cumulative crypto futures open interest dropped 3.5% to $108.3 billion. Funding rates for ETH, BNB, XRP, SOL, TRX, and DOGE all turned negative - a signal that traders are positioning short rather than long. PAXG (tokenized gold) open interest fell nearly 11% in 24 hours as the underlying gold sell-off triggered position unwinds.
Some traders are actively buying downside protection in ether. TDX Strategies flagged activity in ether risk reversals - positions that involve selling call options to fund put option purchases. On Deribit, both BTC and ETH puts are more expensive than calls across all tenors. ETH puts at the front end are pricier than BTC puts, meaning short-term traders are bracing for a larger ether decline than a bitcoin one. Source: CoinDesk
"The deadlock in Iran-U.S. negotiations seems to have triggered renewed risk aversion, leading to capital outflows from crypto derivatives." - CoinDesk Markets Analysis, March 26, 2026
Friday's $14.16 Billion Options Bomb: Why $75,000 Is the Magnet
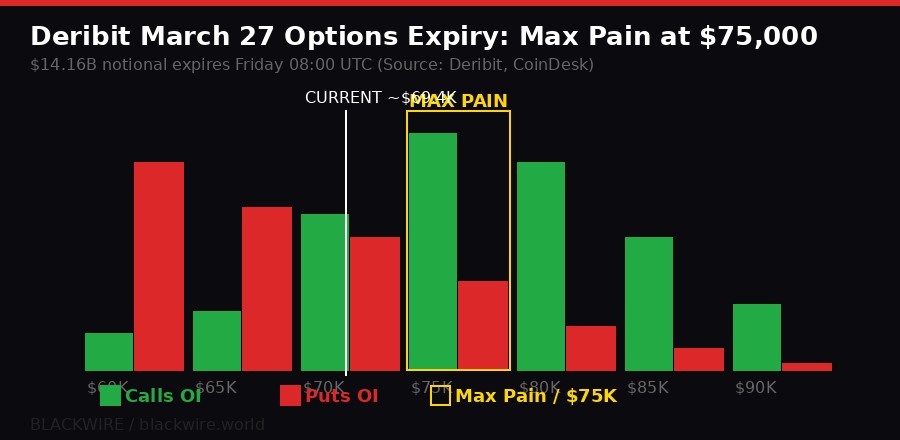
Tomorrow morning at 08:00 UTC, Deribit settles $14.16 billion in bitcoin options - nearly 40% of all open interest on the world's largest crypto options exchange. That's an enormous gravitational event at exactly the wrong macro moment.
The max pain level - the price at which the most options expire worthless, maximizing losses for buyers - sits at $75,000. According to Deribit's Chief Commercial Officer Jean-David Pequignot, this creates a mechanical pull toward that price in the hours before settlement. Source: CoinDesk
"With Bitcoin currently trading near $71K, the $75K Max Pain price represents a gravitational pull. Historically, this encourages delta-hedging by market makers that can drive prices toward the strike where the most options expire worthless." - Jean-David Pequignot, Chief Commercial Officer, Deribit, via CoinDesk, March 25, 2026
Max pain works through market maker hedging mechanics. Options writers - typically large institutions and funds - manage delta exposure by trading the underlying spot and futures markets. As expiry approaches, this hedging activity can mechanically pull spot price toward the max pain level. The effect is most pronounced in the 24 hours before settlement.
Bitcoin is currently trading about $5,600 below max pain. A move from $69,400 to $75,000 before tomorrow morning would represent an 8% rally in roughly 20 hours - a non-trivial ask, especially with oil above $100 and equities selling off. But the implied volatility picture is interesting. Pequignot noted a compression of around 6 points in both BTC and ETH implied volatility indices (DVOL), suggesting the market expects a controlled expiry rather than a volatility explosion.
The Put/Call ratio at 0.63 - below 1 - still leans bullish in aggregate. Institutions have been writing overhead calls to collect premiums, capping upside bets rather than positioning for a crash. The picture is one of cautious, hedged positioning, not full capitulation.
Whether tomorrow resolves at $75,000 or $69,000 depends significantly on whether the Iran news gets worse or better in the next 20 hours.
Gold's Worst Century: The 1920 Parallel and What It Means for Bitcoin
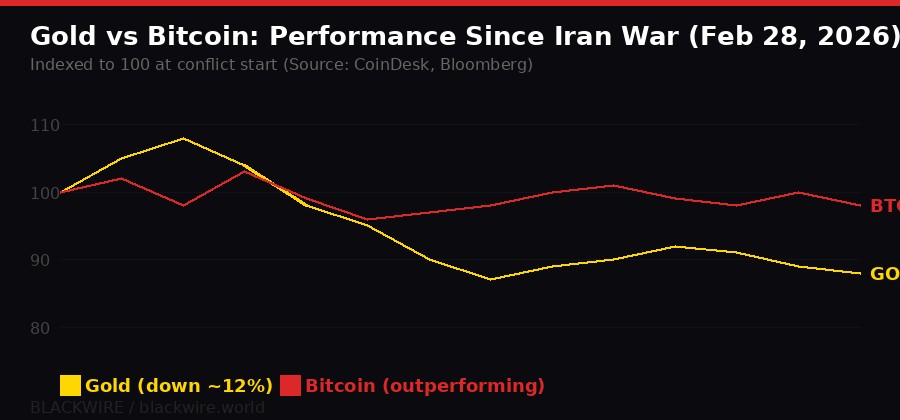
The gold chart is historically ugly. Gold just completed a 10-consecutive-day losing streak - its worst run since February 1920, according to Bloomberg analyst Katie Greifeld. The yellow metal fell as much as 27% from its January all-time high before finding support at its 200-day moving average around $4,090.
The counterintuitive element: gold is supposed to be the safe haven. War breaks out, gold rises. That's the textbook. Instead, since the escalation of Middle East conflict at the end of February, gold is down roughly 12%. The explanation lies in forced selling - margin calls, deleveraging, and institutional repositioning in a world where oil shocks are draining liquidity and forcing portfolio rebalancing. Source: CoinDesk
Bitcoin, by contrast, has held. It's not up - it's down from pre-conflict levels - but the BTC-to-gold ratio has risen 30% since the conflict began, with one BTC now worth approximately 16 ounces of gold. ByteTree's Chief Investment Officer Charlie Morris noted that the ratio has consistently built higher lows since 2017: from 2.7 ounces in 2019, to 3.4 during the pandemic crash, to 9.1 after FTX's collapse, to 12.4 ounces in February. Now 16.
"With gold appearing exhausted, we could reasonably expect a new all-time high above 40 ounces in the coming months or years." - Charlie Morris, CIO, ByteTree, via CoinDesk, March 25, 2026
Bloomberg ETF analyst Eric Balchunas added a counterpoint: bitcoin and gold are not inversely correlated - they're largely uncorrelated. He flagged that gold ETFs like GLD and IAU have seen billions in outflows this past week, while bitcoin ETFs recorded approximately $2.5 billion in inflows this month, with only $140 million in net outflows year-to-date despite bitcoin being down roughly 20% over the same period.
The numbers suggest institutions aren't fleeing bitcoin ETFs even during a 20% drawdown. They're fleeing gold. Whether this reflects a genuine structural rotation or just the mechanics of the current trade - war inflation hedges in gold giving way to oil stock plays - will become clear over the next quarter.
Bitcoin's 50-Day Purgatory: Why the Bears Are Misreading It
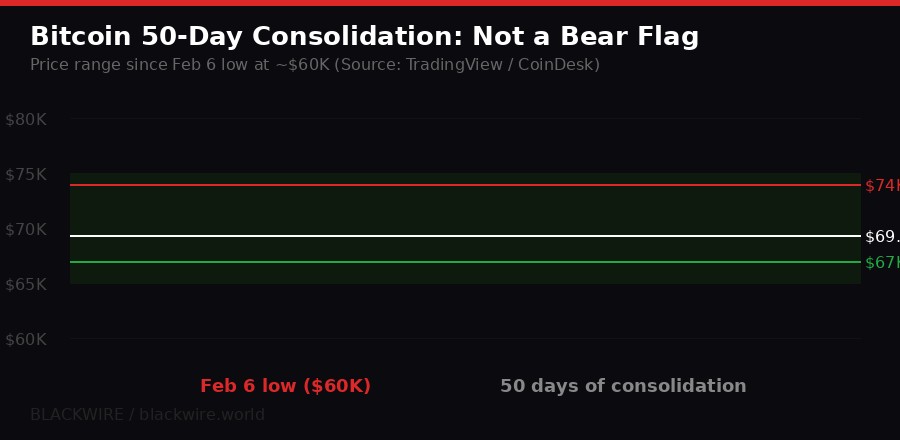
Bitcoin has been locked in a roughly $65,000-$75,000 range since early February. Nearly 50 days. Four rejections at $74,000. Two successful holds at $67,000. It looks - to the casual observer, or the anxious trader - like a bear flag. A brief consolidation before a resumption of the October-to-February downtrend from $126,000 to $60,000.
Standard technical analysis disagrees. Bear flags are short-lived patterns - typically lasting a few days - characterized by a tight, organized counter-trend consolidation that resolves with a breakdown. This consolidation has lasted nearly 50 days, far longer than any textbook bear flag. The duration alone argues against the bearish interpretation. Source: CoinDesk
A more accurate read: indecision. Neither bears nor bulls control the range. Bears failed to push price below $65,000 despite an ongoing war, oil above $100, equity volatility, and a major options expiry approaching. Bulls failed to break $74,000 despite four serious attempts. The market is evenly matched, grinding participants on both sides with time rather than direction.
The 2022 comparison - which bears invoke regularly - also fails the structural test. In 2022, bitcoin crashed from $60,000 to $15,000 through a market that had minimal support built between those levels. The current range of $65,000-$75,000 is different: CoinDesk research estimates more than 600,000 BTC were accumulated in this price zone during the 2024 consolidation period. That's demand waiting to defend its cost basis. Sellers trying to push bitcoin through $65,000 are pushing into 600,000 BTC of entrenched holders who bought at these prices and have no reason to panic-sell.
THE REAL RISK: What could break the range to the downside is not a "bear flag" resolving normally. It's a black swan: a Strategy credit event, an escalation that closes the Strait of Hormuz, or a regulatory shock (see: Clarity Act chaos). Watch $65,000 as the structural threshold. Below that, the 600,000 BTC demand floor becomes untested territory.
The Clarity Act Fracture: Coinbase vs Everyone Else
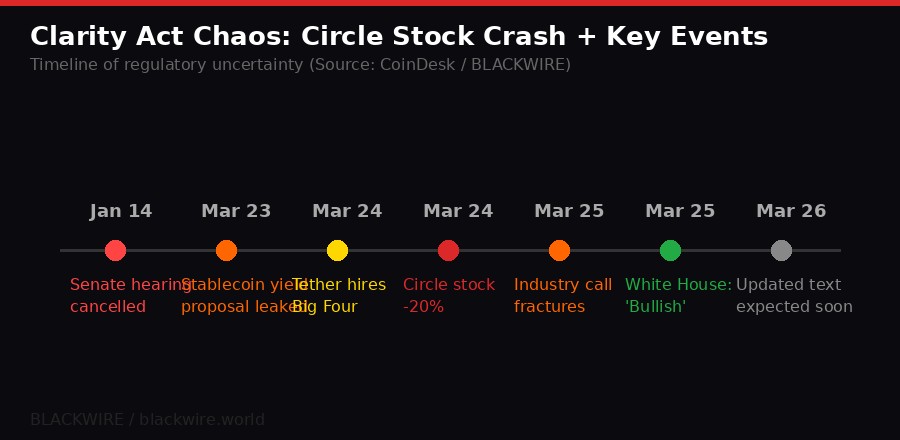
This week's market chaos has a regulatory subplot that's getting underreported. The Clarity Act - the long-delayed U.S. digital asset market structure bill - is fracturing the crypto industry at exactly the moment it needs to show unity to get it over the line.
Congressional staff shared a compromise text with industry stakeholders Monday and with banking industry representatives Tuesday. The crypto reaction was split. Some players were "pleasantly surprised." Others - most notably Coinbase - were not happy. Coinbase CEO Brian Armstrong, who helped kill an earlier Senate hearing by opposing stablecoin yield provisions, is walking a tightrope: unhappy but not publicly opposed. Yet. Source: CoinDesk
The sticking point: the new proposal would restrict rewards programs tied to the scale of stablecoin transactions - which is effectively the model Coinbase uses to compete with Tether on yield. The language could cap USDC-linked rewards programs that represent a significant revenue line for Coinbase. Losing that edge matters when Tether just announced it hired a Big Four accounting firm for a full audit of USDT reserves - a move that validates Tether's legitimacy and directly threatens Circle's "transparency premium."
Circle's stock dropped 20% Tuesday on news of the stablecoin yield provisions. Coinbase, which holds a significant stake in Circle and earns fee revenue from USDC, took a correlated hit. Wednesday saw a partial recovery, but the structural concern - that the Clarity Act could simultaneously give crypto regulatory legitimacy while capping some of its most profitable products - remains.
"It's all going to work out. Bullish." - Patrick Witt, White House crypto adviser, posting on X after Clarity Act criticism, March 25, 2026
That kind of dismissive optimism from the White House carries weight but provides no mechanics. The fracture is real: an "industry call this week" saw Coinbase clash publicly with other stakeholders over the bill. An industry divided at the negotiating table is less likely to get what it wants in the final text.
Expect the updated text to drop late this week or early next week. How Coinbase responds publicly to that text will determine whether the Clarity Act clears the Senate or dies in another extended standoff. Given that Armstrong has blocked progress before, markets should not price certainty into a positive regulatory outcome.
The DATCO Warning: What Happens If Saylor Stops
The DATCO collapse is not just a story about other companies giving up on the treasury model. It's a stress test question about the bitcoin market's resilience without its largest remaining structural buyer.
Consider the math. Strategy bought 45,000 BTC in the past 30 days. At $69,400 per BTC, that's approximately $3.12 billion in purchases. All other corporate buyers combined bought 1,000 BTC - roughly $69 million. The difference in demand is not marginal. It's categorical.
Bitcoin ETFs have been a bright spot: $2.5 billion in monthly inflows versus minimal outflows. Retail and institutional ETF demand is holding. But ETF flows are passive and correlated to price - when price drops, outflows follow. Strategy's buying has been explicitly counter-cyclical: accelerating as price falls, funded by equity and debt markets that remain open to Saylor's pitch as long as bitcoin holds above his average cost basis.
Strategy's average cost basis, last publicly disclosed, sits somewhere in the $55,000-$60,000 range on recent acquisitions. At $69,400, Strategy is still above water. But if bitcoin breaks $60,000 - the February low - Strategy's new acquisitions move into negative territory. That doesn't trigger a forced sale automatically, but it changes the narrative for equity investors and debt holders who are implicitly subsidizing the buying.
Galaxy's July 2025 warning about the flywheel reversing applies equally to Strategy itself, not just its imitators. The imitators already reversed. Strategy is still running. But the conditions that could reverse Strategy's flywheel are not abstract: a sustained move below $65,000, a credit market that closes to new convert issuance, or a bitcoin ETF that finally captures institutional demand so efficiently that equity-premium-based accumulation becomes structurally obsolete.
None of these are base cases for tomorrow. But in a market where concentration in one balance sheet has reached 76%, the tail risk deserves serious weight.
Timeline: March 2026's Cascade
What Traders Are Watching Now
Four numbers define the next 72 hours. First, $74,000: four rejections and counting, this is the level that separates the current consolidation from a genuine breakout. A close above $74,000 - especially on any positive Iran news - would flip momentum sharply. Second, $67,000: the institutional bid line that has held twice during the current range. A break below this on heavy volume changes the structural picture materially.
Third, $100 per barrel for oil: this is the pain threshold for equities and the trigger for sustained risk-off. Oil above $100 is manageable. Oil above $110 - which the market has already seen once this conflict - starts breaking things in leveraged positions across asset classes. Fourth, the Clarity Act text: whenever Congress drops the updated version, Coinbase's public response will be the market signal that determines whether crypto's regulatory window stays open in 2026.
The macro convergence is unusual. Typically, one major variable dominates at a time. Right now, bitcoin is simultaneously being squeezed by: geopolitical risk (oil, Iran), structural concentration risk (Strategy monopoly), regulatory uncertainty (Clarity Act), and a massive options expiry event. These four factors are not offsetting each other - they're compounding.
Strategy will keep buying. Saylor has made that clear in every public communication. The question is what happens to bitcoin's price support if even one of the other variables breaks badly. The concentration risk is not theoretical. It's the defining structural feature of the crypto market in March 2026, and it gets remarkably little attention relative to its systemic importance.
One balance sheet. 76% of corporate BTC. An oil-driven derivatives unwind. A $14 billion expiry in 20 hours. The Clarity Act fracturing. And gold in the worst losing streak since Woodrow Wilson was President.
Bitcoin is fine. Until it isn't.
Get BLACKWIRE reports first.
Breaking news, investigations, and analysis - straight to your phone.
Join @blackwirenews on Telegram